
The global installed base of smart meters crossed 1.8 billion units at the end of 2024, and Counterpoint Research expects it to pass 3 billion by 2030. A meter reporting on 15-minute intervals sends 96 readings a day, which means a utility running one million meters receives close to 100 million data points daily. That count does not include voltage events, tamper alarms, communication logs, or field updates. Utilities have never had this much visibility into their own networks.
The problem is that visibility has grown faster than the ability to use it. Readings sit in the head-end system, billing exceptions sit in another application, and outage signals sit in a third. Engineers still export spreadsheets to work out what happened, and by the time they do, the moment to act has often passed. More meters have produced more screens to watch, not faster decisions.
This is the gap AI is starting to close. Its real value in utility operations is not better reports. It is connecting the data a utility already collects to the decisions its teams make and the work its field crews execute.
What Does AI in Utilities Mean and Where Does It Fit in the Technology Stack?
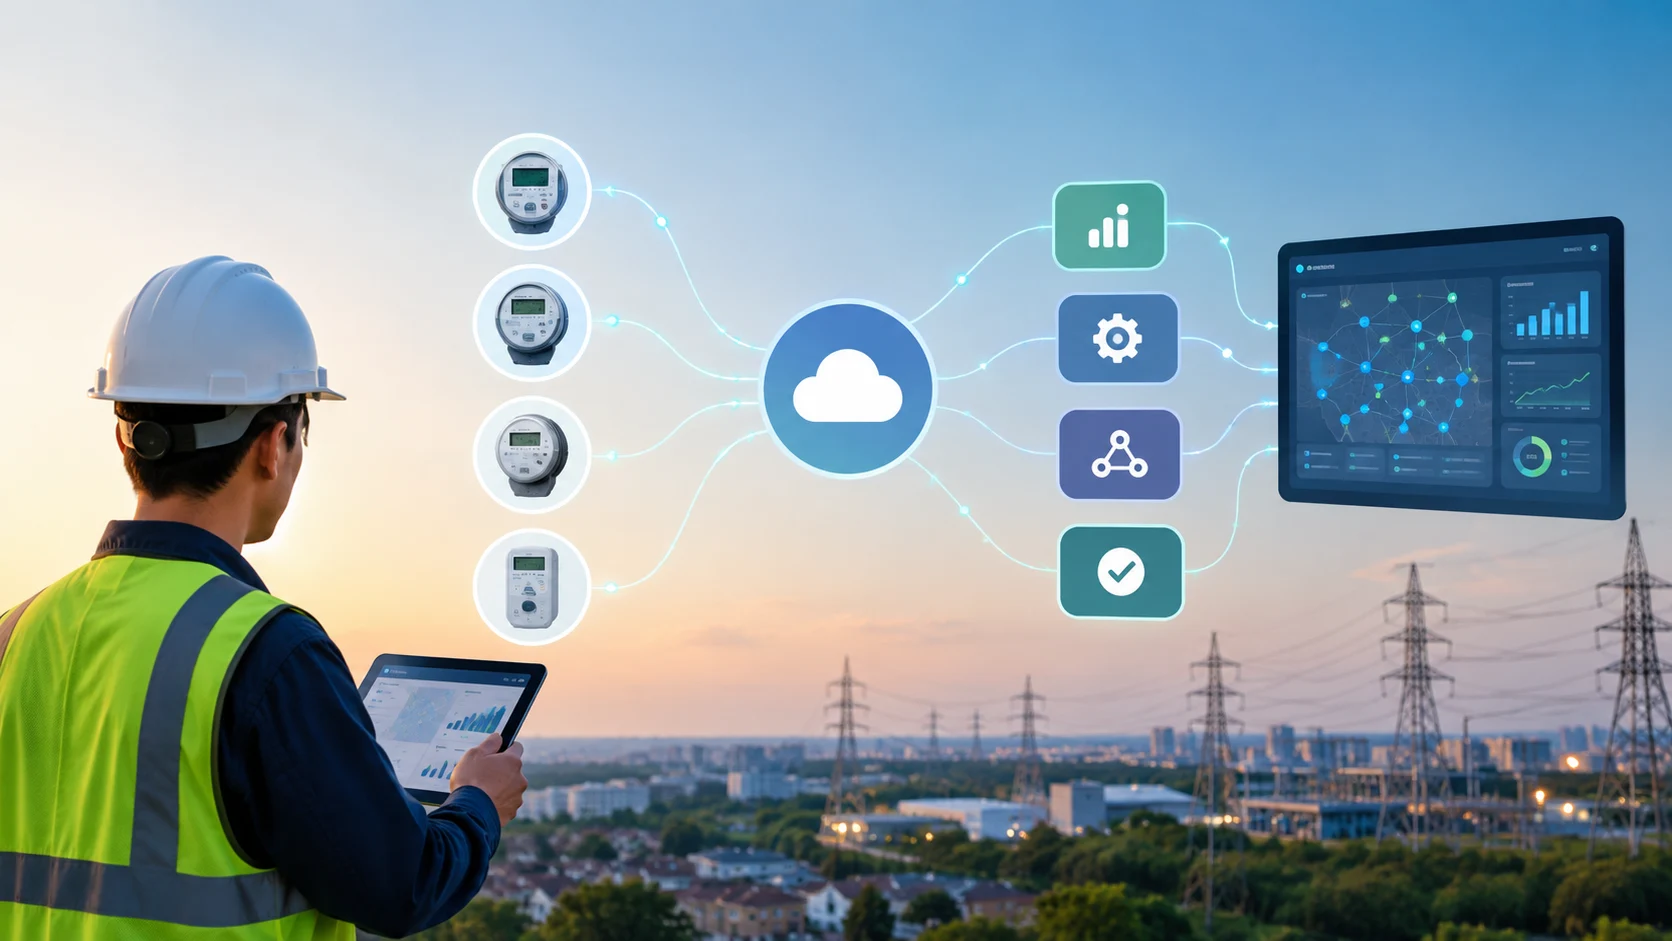
AI in utilities works best as a decision layer that runs on top of the systems a utility already operates. It reads from them, reasons across them, and pushes actions back into them without replacing any of them.
To see why that placement matters, look at what a typical utility already runs.
- The Head-End System (HES) collects raw reads and events from the meter fleet.
- The Meter Data Management (MDM) system validates those reads and prepares them for billing.
- Supervisory Control and Data Acquisition (SCADA) watches the network in real time.
- The Geographic Information System (GIS) knows where every asset sits.
- The Outage Management System (OMS), billing, and Enterprise Resource Planning (ERP) each hold their own slice of the operation.
These systems were never built to talk to each other at the speed operations now demand, and that is the gap AI occupies.
The technology filling that gap has also moved from fixed rules and static reports, to machine learning that predicts failures and load, to agentic AI that detects an issue, decides the next step, and triggers it on its own with human approval wherever the utility wants control.
How does AI turn raw AMI and SCADA data into decisions?
Collecting data is only the first step. The real challenge is identifying which of the day's millions of readings actually require attention, and many utilities still rely on manual analysis to answer that.
AI addresses this by correlating related signals, comparing them with historical patterns and known operating baselines, then highlighting what is abnormal and why it matters.
The value lies in the context. A single meter reading says very little on its own. Viewed alongside neighbouring meters, network events and the meter's own history, it becomes much easier to separate random noise from a genuine fault. One meter going silent may be a communication issue. Ten meters on the same transformer going silent after a voltage dip is likely to indicate a network fault.
Unlike a rules engine, AI is not limited to conditions someone has predefined. It can surface patterns and relationships that were never explicitly programmed, helping utilities identify issues that would otherwise go unnoticed.
A capable AI layer typically performs four functions:
- Correlates meter events with network topology and asset history so each reading is evaluated in context.
- Flags consumption patterns that indicate possible theft or tampering at both the feeder and consumer level.
- Predicts assets that are likely to fail over the next 30, 60 or 90 days, allowing maintenance to be planned before breakdowns occur.
- Prioritises exceptions by urgency, helping teams focus on the handful of issues that matter most.
Grid AI works on top of existing HES, MDM, SCADA and GIS systems rather than replacing them. Engineers can ask questions in plain language, such as which feeders recorded the highest losses this week, and receive ranked results with the supporting evidence instead of manually analysing raw data.
What Separates Static Dashboards from Agentic, Closed-Loop AI?
Dashboards stop at visibility, while agentic AI carries an issue from detection through ticketing, routing, and closure. The difference decides whether teams spend their day interpreting screens or reviewing completed work.
What Can a Dashboard Do, and Where Does It Stop?
A dashboard collects numbers from multiple systems, displays them on one screen, and refreshes them in near real time. For most utilities, this solved the visibility problem it was designed for.
Its limit is however context. A dashboard can show that consumption on a feeder is well above last week, but it does not know the feeder serves 400 consumers or that this pattern usually points to theft rather than load growth. A person still has to interpret the chart, confirm the cause across other systems, and raise the follow-up work by hand.
How Does an Agentic System Detect, Act, and Run Analysis on Its Own?
An agentic system handles that follow-up itself, in one connected sequence.
- Detects the anomaly by reading meter, network, and event data together.
- Decides what it points to, a dead device, a network fault, or suspected theft.
- Acts by raising the ticket and routing it to the team that owns the asset, with sign-off steps wherever the utility wants them.
- Tracks the job to closure, so nothing dies in an inbox between detection and resolution.
It can also run without being prompted. An agent can be assigned a recurring question, for example transformer aging and fault analysis, pointed at the relevant worksheets and reports, and scheduled to run every night with the findings delivered each morning as a ready report and a notification.
What Changes for Operations Teams Day to Day?
Three routines start to disappear:
- Rebuilding the same report every week, because the agent keeps it current.
- Stitching data from four systems together to answer a single question.
- Discovering a dead meter at the bill run, weeks after it went quiet.
Also Read: Agentic AI in Utilities: From AMI Dashboards to Grid Governance : Grid
How Does AI Change Field Execution, Not Just the Control Room?
An insight that never reaches the field is a cost, not a gain. The last mile of the closed loop is getting the right job to the right technician with the full context attached, and this is where many utility AI efforts quietly stall.
Follow one event through the loop to see what that takes.

Step 1: A meter goes silent
A smart meter misses its scheduled reads for 48 hours. A metering operations layer like Grid SMOC tracks each meter against its expected communication pattern, so the meter is flagged automatically instead of surfacing weeks later as a billing exception.
Step 2: The system checks for the bigger problem first
Before anyone is sent out, the AI reads the meter against its surroundings. Neighbouring meters on the same transformer are still reporting and SCADA shows no voltage event, which means this is one dead device, not a network fault.
Step 3: A job is created and routed automatically
A rules-and-workflow layer turns that finding into an inspection job, sets its priority, and routes it to the crew that owns that part of the network. No email chain, no manual sorting.
Step 4: The technician gets the job with context, not just an address
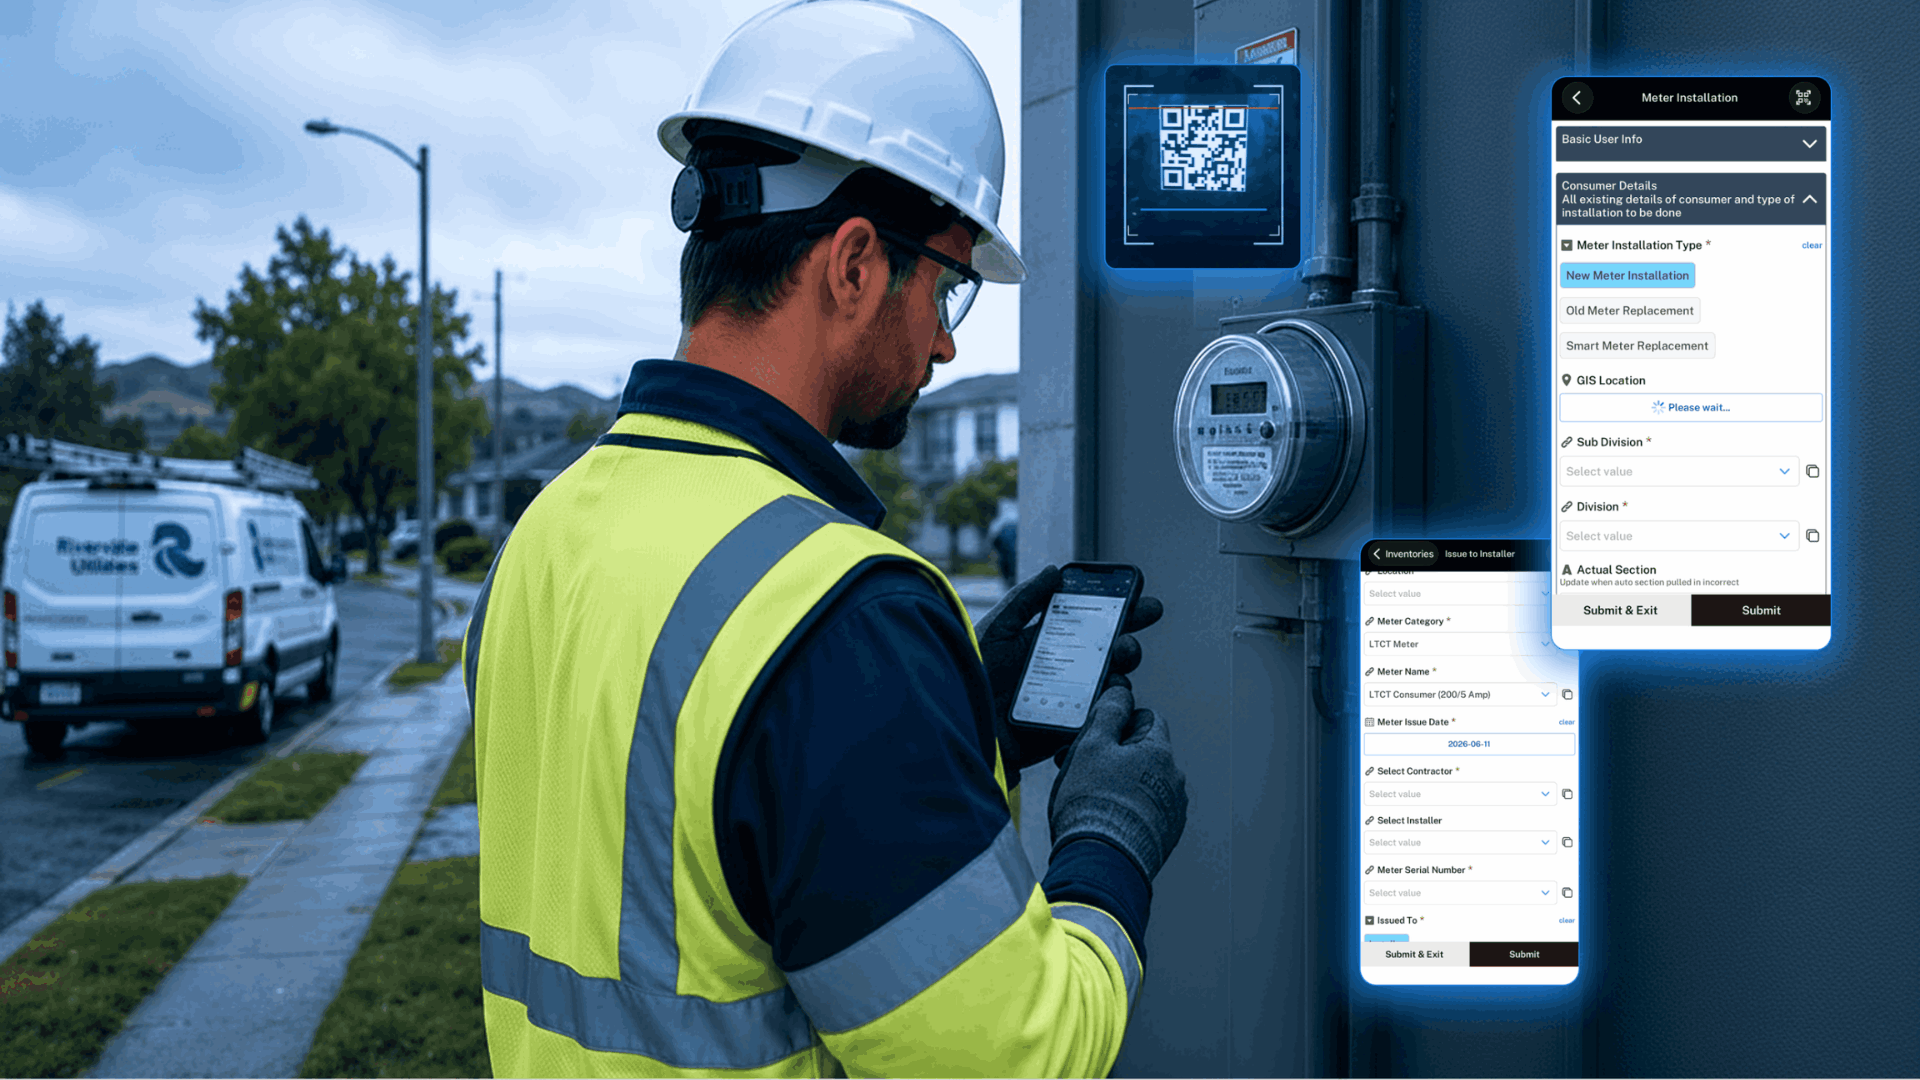
In a field app like Grid's Frontline Operations, the technician sees the meter's location on a GIS map, its recent history, and a checklist for this fault type. All of it works offline, because the sites with the worst-performing meters often have the weakest connectivity.
Step 5: The job closes with proof
The technician records geotagged photos and readings on site, and the app checks the job details before accepting them, which cuts wrong-meter errors. Once connectivity returns, the data syncs and the original alert closes with a verified record behind it.
The whole journey runs from a missed read to a closed, documented job without a person carrying it between systems by hand. That is what field execution looks like when the loop closes, and it is also where the returns start to show up in numbers.
Where Do Utilities See Measurable Value From AI First?
The fastest returns show up where losses can already be counted. Stolen units, missed SLAs, failed transformers, and report-building hours all have a number attached, which makes them the natural place to start.
Four areas consistently pay back first.
- Revenue protection. AI reads interval data, tamper logs, and transformer-level reconciliation together to flag likely theft, ranked and ready for inspection. Every recovered connection is revenue the utility was already generating and simply not billing.
- Meter communication and SLA performance. Silent meters get caught in hours instead of surfacing at the bill run. In one deployment, Grid's SMOC tracked SLAs in real time across 400,000 meters, monitoring 19 million data points a day with automated workflows.
- Predictive maintenance. Moving from calendar-based servicing to risk-based scheduling means crews reach the failing transformer before the outage. Operationalized well, this carries an uptime improvement potential of 15 to 20% and can extend asset life by 2 to 3 years.
- Reporting and compliance. Regulatory reports that once meant stitching exports from several systems become scheduled outputs, and one water utility running 480,000+ smart meters on this model reached up to 88% data coverage with stronger compliance readiness.
The pattern across all four is the same. The value does not come from new data, it comes from acting on existing data quickly enough for the action to matter.
Conclusion
The utilities pulling ahead are not the ones with the most data or the newest dashboards. They are the ones that have closed the gap between seeing a problem and acting on it, so a silent meter, a failing transformer, or a theft pattern becomes a resolved job instead of another alert waiting for someone to notice.
That shift is hard to judge from a feature list, and easy to judge from your own data. See what Grid surfaces on a sample of your metering data, and make the platform prove the result on the network you actually run. Book a demo with the Grid team, and bring the questions your operation has been unable to answer.
FAQs
- What are the main use cases for AI in utilities?
The highest-value ones are theft and loss detection, predictive maintenance on transformers and assets, meter communication and SLA monitoring, and the automatic field jobs that follow.
- How is AI used in energy and grid management
AI reads smart meter, SCADA, and sensor data together to catch what a single system misses, like a voltage dip that signals a failing transformer. It forecasts demand, flags problems as they happen, and can trigger the fix rather than just showing an alert.
- Does AI replace utility workers, or support them?
It supports them. AI takes over the repetitive exporting, reporting, and alert-sorting so teams focus on judgment and repair. Decisions that carry real consequence still sit with a person.
- What are the challenges or risks of adopting AI in utilities?
The usual failure points are data and integration, not the AI itself: readings trapped in disconnected systems, poor data quality, and rigid legacy software. Utilities that succeed start with one countable problem rather than automating everything at once.
- How do utilities keep customer and meter data secure when using AI?
Through encryption, access controls, and recognized certifications like SOC 2, ISO, and GDPR compliance. Since meter data is consumer data, the standard to look for is one an auditor would accept, not just a general security claim.
- What is the difference between AI chatbots and AI in grid operations?
A chatbot answers customer questions about bills and outages. AI in grid operations works on machine and sensor data to detect faults, predict failures, and drive field work. One improves the conversation, the other changes how the network runs.

.webp)
.png)


