
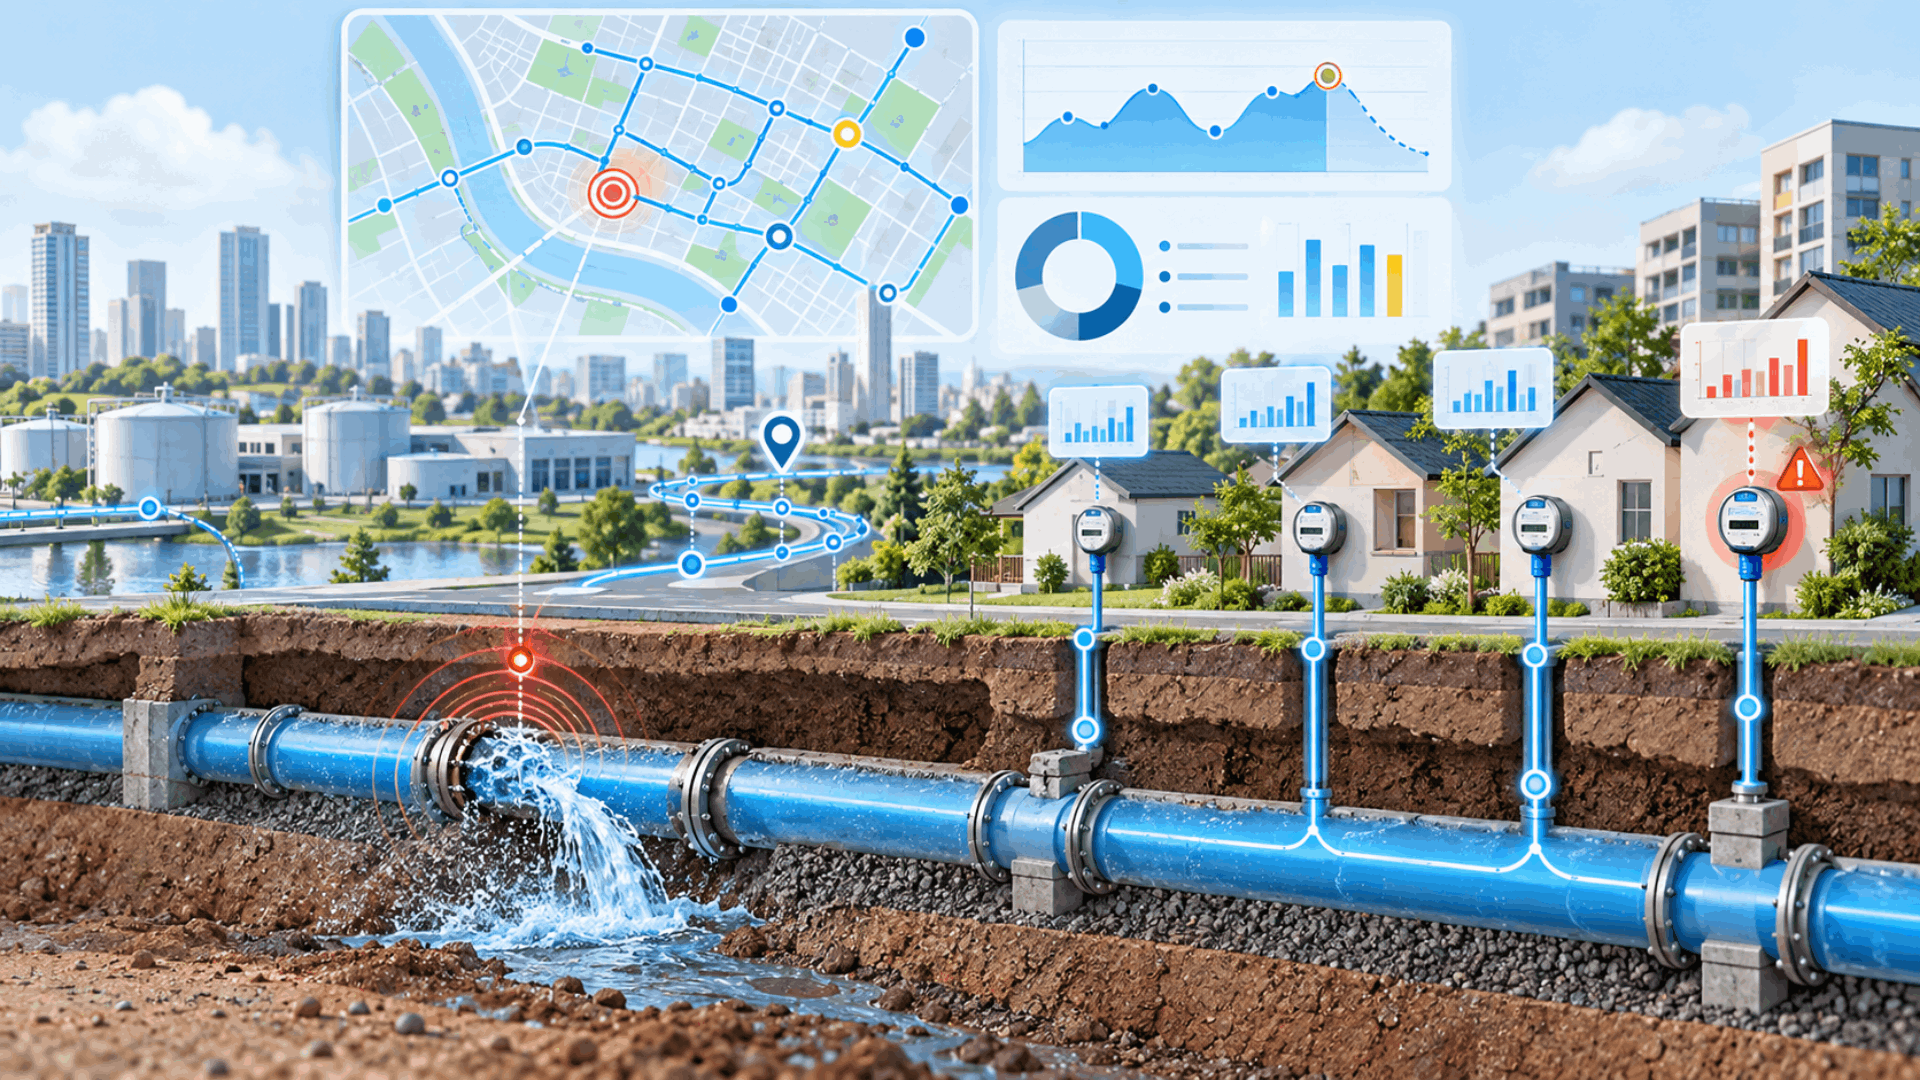
Water utilities lose roughly 36% of the water they produce to non-revenue water (NRW) on average, according to a 2025 International Monetary Fund estimate. Globally, that adds up to about 126 billion cubic metres of water and US$39 billion in economic losses every year.
But the NRW percentage alone does not reveal what is actually happening in the distribution system. Water may be escaping through a leaking main, passing through an under-registering meter, being consumed through an unauthorised connection, or reaching a customer without being recorded correctly for billing. Each creates a loss, but the operational response is very different.
The challenge for a water utility is therefore to move from knowing how much water is unaccounted for to knowing where the loss is concentrated, what is driving it and which intervention deserves attention first. As utilities collect more meter and network data, analytics can help turn those signals into a clearer view of where losses are occurring and which problems need closer investigation.
What is non-revenue water and what makes it up?
Non-revenue water (NRW) is the difference between the amount of water entering a utility's distribution system and the amount that is ultimately billed to customers.
NRW = System input volume − Billed authorised consumption (Here, system input volume is the total water supplied into the distribution network, while billed authorised consumption is the water that is legitimately consumed and successfully measured and billed).
Utilities commonly use a water balance to account for the water entering the distribution system and show how much becomes billed consumption, authorised unbilled use, apparent losses and real losses.
This difference comes from three components: real losses, apparent losses and unbilled authorised consumption.
.png)
Understanding what sits inside NRW matters because each component represents water the utility has already spent resources to produce, treat or supply without recovering its full value. When these NRW losses accumulate across a distribution network, the impact moves beyond a percentage on a report and starts affecting operating costs, maintenance capacity and revenue.
How high NRW affects utility operations and revenue
High NRW means a utility has already paid to treat and pump water that does not fully generate revenue. When physical losses are high, more water may need to be produced and moved through the network to meet the same demand, increasing energy use and operating costs. Persistent leaks and bursts add repair work, consume maintenance capacity and tie up budgets when the same problems keep recurring.
Apparent losses affect revenue differently. The water reaches the customer, but under-registering meters, unauthorised consumption or billing gaps mean the utility does not recover its full value.
These losses can also be distributed very unevenly. Ghana Water Limited reported 49.2% NRW nationally in Q1 2026, but regional levels ranged from 25.4% to 66.1%, leading the regulator to call for priority intervention in the higher-loss regions. A single national or utility-wide NRW figure can therefore hide where the greatest losses are concentrated.
Also Read: Smart Water Metering: Benefits & Use Cases for US Utilities : Grid
How do utilities narrow down where NRW is concentrated?
An overall NRW percentage tells a utility how much water is unaccounted for, but it does not show where the loss is concentrated. Utilities need to break that number down across the distribution system before deciding where investigation and resources should go.
This can include looking at:
- Regions or operating zones: Comparing NRW across service areas can show where losses are consistently higher than the utility average.
- District Metered Areas (DMAs): Comparing the water entering a DMA with the consumption recorded within it helps identify areas with a larger unexplained gap. Geographic Information System (GIS) can add the spatial context needed to see how those loss areas relate to pipes, valves, meters and other network assets.
- Pressure zones: Persistent losses in particular pressure zones can help narrow the part of the network that needs closer attention.
- Customer and meter groups: Comparing consumption across customer segments or meter populations can surface unusual gaps that may not be visible at network level.
- Changes over time: A sudden increase or a persistent rise in losses within the same area can help distinguish an emerging problem from a long-standing one.
These comparisons depend on reliable meter, bulk-flow and customer data. Missing reads, inaccurate measurements or incomplete account records can make one area appear to have a larger loss than it actually does.
How do utilities identify what is driving NRW?
Once utilities know where the loss is concentrated, they need to determine what is causing the gap. That distinction matters because the same high-loss area can point to very different problems, from a physical leak to a meter or account issue. Reading the signals correctly helps teams avoid treating every NRW gap as the same type of loss.
Some of the signals that can help include:
- High minimum night flow: can point to physical leakage.
- Sudden changes in flow or pressure: may indicate a burst or developing leak.
- Water supplied without matching recorded consumption: can point to leakage, metering or account-related issues.
- Missing or irregular meter reads: may reflect a meter or communication problem rather than lower consumption.
- Consumption without a valid customer or account mapping: can leave genuine usage outside the normal billing process.
Looking at these signals together helps utilities narrow down whether the loss is coming from the network itself or from the way consumption is being measured and accounted for.
What actually helps utilities reduce NRW?
Reducing NRW usually requires a combination of measures rather than one solution. The right mix depends on whether the loss is coming from the network, metering and billing processes, or authorised water use that is not being billed.
- Active leakage control: finding and repairing leaks before they remain undetected for long periods.
- Pressure management: controlling excessive or fluctuating pressure that can increase leakage and pipe failures.
- Faster, effective repairs: reducing how long water continues to be lost after a leak or burst is identified.
- Network and asset renewal: replacing deteriorated mains, service connections and other assets where recurring losses justify investment.
- Meter accuracy and revenue controls: identifying under-registering meters, unauthorised consumption, account mismatches and billing errors.
- Accurate accounting of authorised use: measuring legitimate unbilled consumption so it does not remain part of an unexplained NRW figure.
These methods address different parts of the NRW problem. As utilities use them across the same network, the next challenge is getting a wider operational view of what the data is showing and making those insights easy for operators and teams to use.
How WorkOnGrid brings operational intelligence to NRW management
NRW-related information can sit across Head-End Systems (HES), Meter Data Management (MDM), Supervisory Control and Data Acquisition (SCADA), sensors, billing, customer and other utility systems. Looking at these sources separately makes it harder to see whether a loss is linked to leakage, missing meter data, unusual consumption or an account issue.
- Grid Vault gives utilities a common data and analytics layer for this information. It collects and stores meter and network data, prepares it for analysis, and presents it through reports, dashboards and GIS-based views. This helps teams track leakage patterns, missing reads, meter performance and other NRW-related exceptions with the network and customer context around them.
- When an issue needs further action, Grid Flow can apply utility-defined rules and move it into the next operational step. Alerts and follow-up actions can connect with systems such as HES/MDM, billing, Customer Relationship Management (CRM) and Workforce Management (WFM), helping teams move from identifying an exception to getting it investigated and resolved.
At one water utility managing 480,000+ smart meters, WorkOnGrid helped address inconsistent meter reporting, delayed identification of silent meters and consuming meters that were not mapped to active customer accounts. The utility compared expected and actual reads, applied segment-specific leakage thresholds and identified unmapped consumption earlier, reaching 88.2% communicating-meter coverage and surfacing 95,430 devices with leak alarms within 72 hours. Read the full Revenue Protection for a Leading Water Utility case study.
If your utility is looking to get more operational value from its smart water meter, network and customer data for NRW management, talk to our experts about how WorkOnGrid can fit into your existing systems and processes.

.png)
.png)


