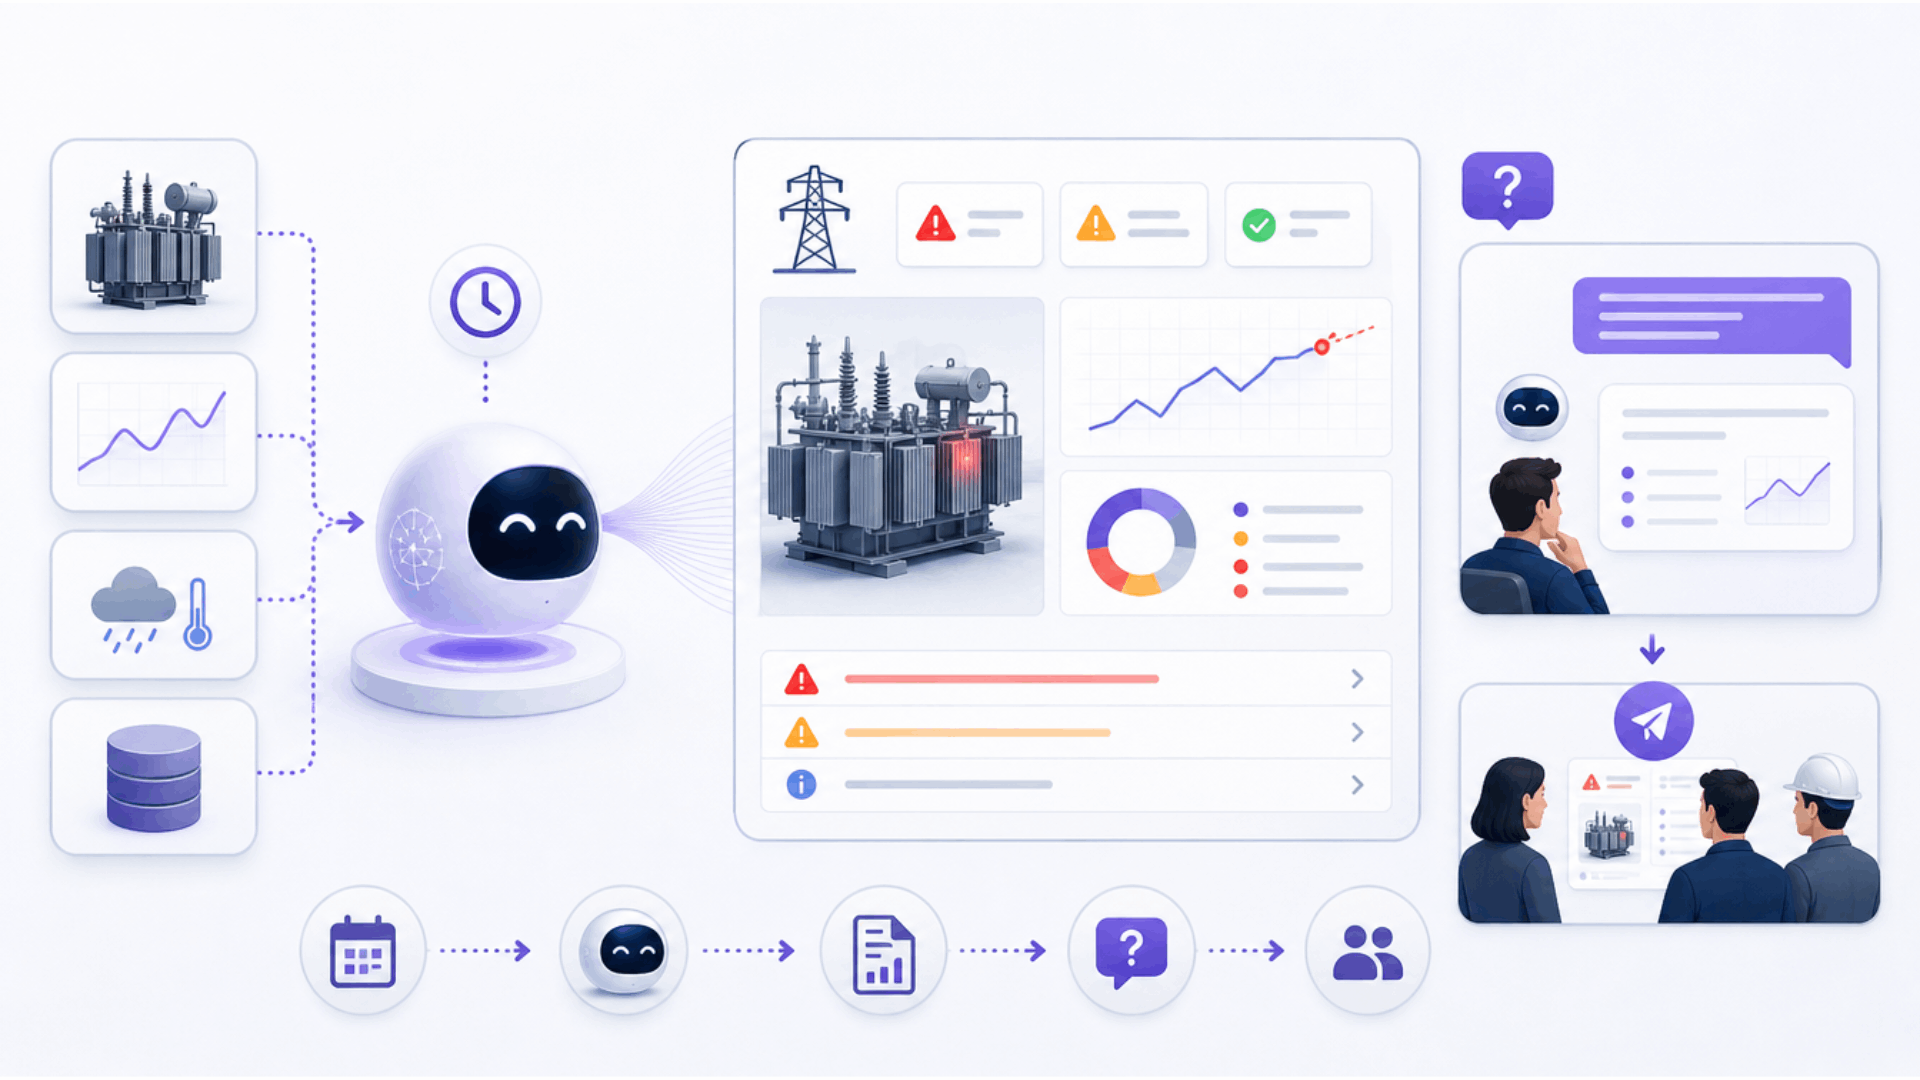
A distribution utility runs the same analyses again and again. Which transformers are ageing or heading for a fault. Which meters have stopped reporting. Where losses point to theft. Which outages ran past their restoration target. Each one is a question someone answers by pulling the data, reading it, and turning it into something the team can act on. And each one has to be answered again next week, because the network keeps moving.
The Grid platform sits on top of the systems a utility already runs, and Grid AI works on the data inside it. Its Analysis Agents are how that recurring work gets handled. You set an agent up once, give it a job and a schedule, and it runs that analysis against your own data, on its own, and reports back. One agent might watch AMI network health, while another might track transformer condition.
What an agent hands back is a report the team can act on, not a table to decode. You can question it, and you can share it with the people who need it.
Where your agents live in the Grid AI dashboard
Every agent you build with Grid AI lands in one place. Open Analysis Agents, and the home page is the first thing you see.
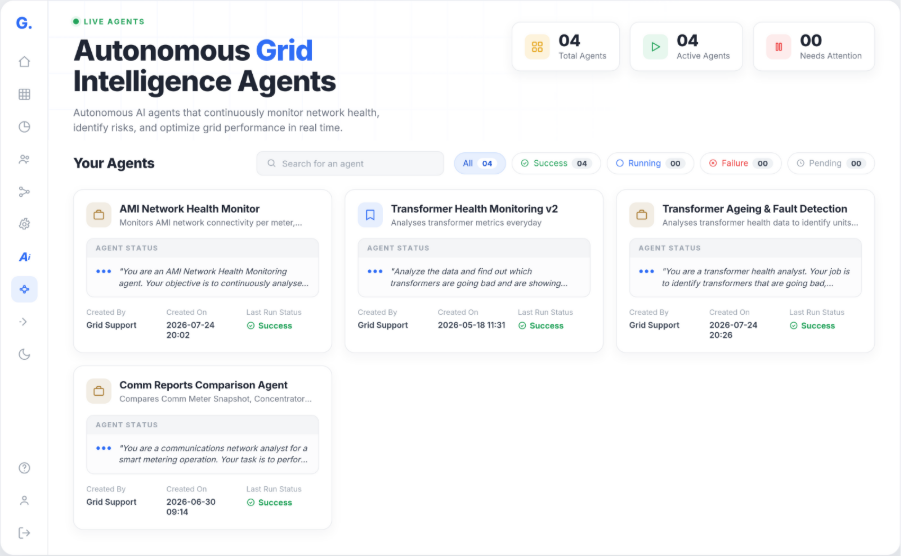
Grid AI lets teams set up separate Analysis Agents for recurring jobs. One can monitor AMI network health, another can analyse transformer metrics, and another can be configured specifically to identify transformers showing signs of ageing or faults, and so on. Each agent works against the relevant utility data.
The Analysis Agents dashboard brings all of these jobs into one view. From here, the team can quickly see:
- Total agents configured in Grid AI
- Active agents
- Agents that need attention
- Run status across agents: successful, running, failed or pending
- What each agent is set up to do
- The status of its latest run
So instead of opening every agent to check whether its analysis ran, the team can see what is working and what needs attention from the dashboard itself.
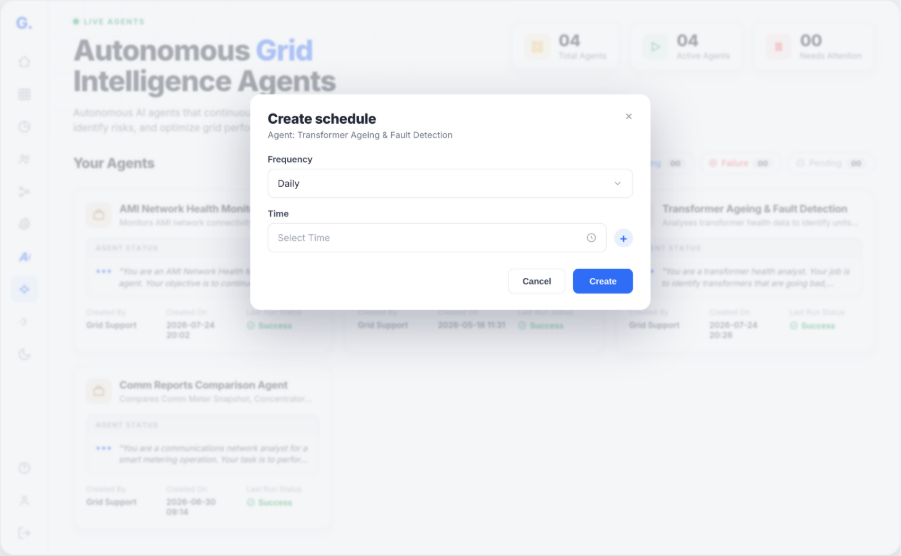
Each Analysis Agent can also run on a schedule. For the transformer health check, the team can set the agent to run every morning at a chosen time. Once the schedule is set, Grid AI runs the analysis automatically, so the latest transformer health results can be ready when the team starts its review.
Also Read: Utility AI Agents: The Next Evolution in Grid Intelligence : Grid
Grid AI turns raw readings into a report you can act on
Utility analysis can end with a table of readings. The values are there, but understanding them still requires someone who knows what each column means and which readings deserve attention.
That matters in a transformer health review. A table may show load factor, losses, power factor and other measurements for every transformer, but the reader still has to decide which units are showing signs of ageing or faults.
Grid AI’s Analysis Agent changes how that result is presented. Instead of returning a simple text or Markdown-style output, it can now generate a structured HTML report with headings, visuals and the main findings brought forward.
Take the Transformer Ageing & Fault Detection agent.
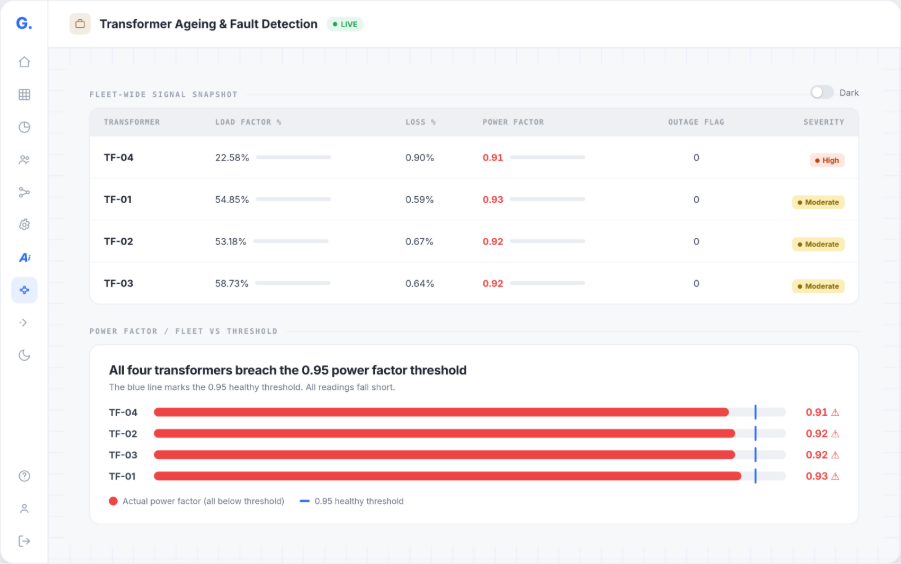
The report starts with the fleet-level finding and an executive summary. In the example shown, four transformers have been analysed, and the report separates them by severity, making it easier to see which unit needs attention first. The supporting data is still available underneath.
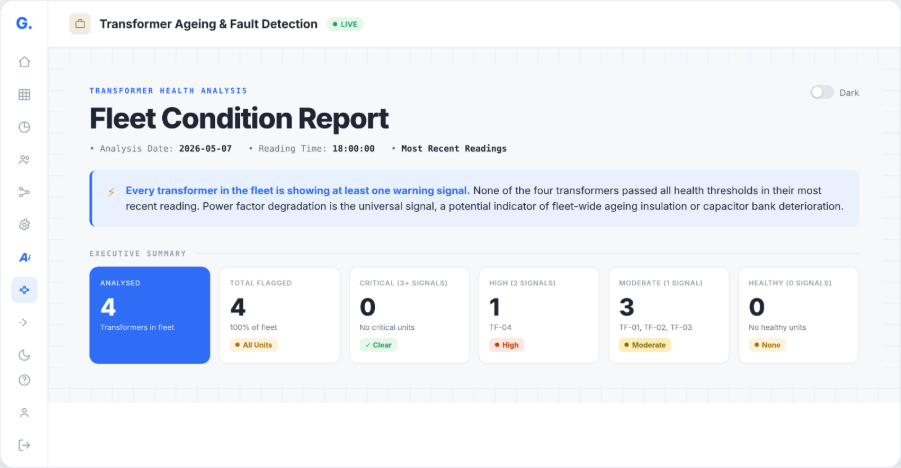
The report brings the transformer readings together in a fleet-wide view and uses visuals to show how individual units compare with the defined thresholds. A reader can see the exception before going into every individual reading.
Further down, the report explains why particular transformers were flagged.
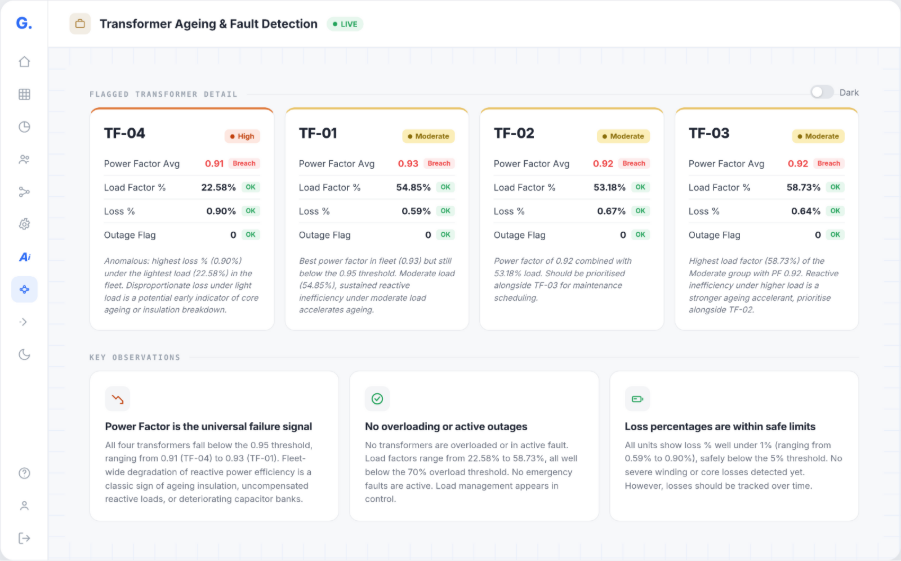
For each flagged unit, the report says why it landed there in a brief description. For instance, in the image below, TF-04 carries the highest loss in the fleet under the lightest load, a possible early sign of core ageing. It closes with the observations that matter: power factor is the signal showing up across the whole fleet, nothing is overloaded or in active outage, and losses are still within safe limits but worth watching.
So, the report does what the table never did. It tells you what is wrong, why, and what to look at first. The analyst still owns the judgement. What goes away is the time spent turning a table into something the rest of the team can read.
Ask the agent questions about the report
A report will sometimes raise a question of its own. You read it, something catches your eye, and you want to understand it better before you act.
Take the power factor, for instance. The report flags all four transformers for breaching the 0.95 threshold. A fair question to ask is whether 0.95 is even the right line for this fleet, or why TF-04 is the one flagged highest?
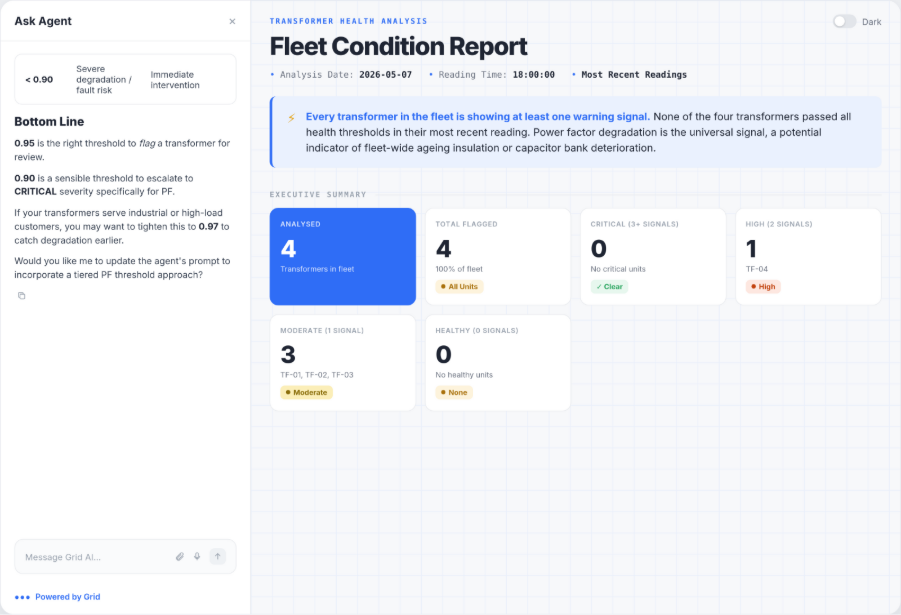
You do not have to go and find someone to answer that. You can ask the agent directly, right where the report is. You type the question, for example, "What should the ideal threshold be for the PF Avg?" The agent reads the report it just produced and answers in plain language, telling you what that threshold means for this fleet and what it would suggest.
Anything in it you do not understand, you can ask and get your answer without leaving the report.
From recurring analysis to a workflow that keeps moving
Transformer ageing was just one example. The same setup works for any question a utility asks on a cycle. Which meters have stopped reporting. Where losses point to theft. Which outages breached the restoration target. Which billing exceptions repeat every cycle. You set one agent, and the answer keeps arriving on its own.
The analysis comes back as a structured report that shows what needs attention, keeps the supporting data close, and lets the team ask follow up questions before deciding what to do next. The judgement stays with the analyst, while the time spent pulling data and turning it into something readable does not.
This workflow also starts one step earlier. In Ask, Build, Watch: How Grid AI Handles Transformer Health (must-read!), we showed how a utility turns a single question into an Analysis Agent that keeps running. Together, the two pieces trace one recurring question from the first analysis through to a scheduled check that keeps the latest findings in front of the team.
Want to see how Grid AI fits into your utility's recurring analysis? See it on your own data by booking a demo.


-compresso.webp)