.jpg)
How is Utility Management Being Redefined Across Water Utilities?
Ensuring quality of drinking water, keeping bills affordable, and maintaining a reliable supply network are some of the most pressing issues that US water utilities face today. Moreover, utility bodies are now required to explain and defend their decisions to regulators and communities they serve:
- How are they setting rates?
- Where are they investing in pipe replacement?
- How are they responding to leaks and water quality issues?
The challenge is that most water systems were not built to handle the kind of operational and regulatory pressures that utilities face now. Decades ago, the networks beneath our streets were designed for one-way water flow management and periodic manual inspections. Water utility management in the 2020s include roadblocks such as:
- Aging pipes and infrastructure that tends to fail often and costs more to replace
- Climate or extreme weather events that put stress on already fragile systems
- Continued use of lead service lines that pose health risks and hazards
- High NRW (non-revenue water) levels that erode financial health
- Workforce and process gaps, with important decisions depending on spreadsheets, call logs and institutional memory
The scale of loss from NRW alone itself is staggering. Recent research indicates that 19.5% of drinking water is lost before it reaches the consumer. This alone costs water utilities a loss of more than $6.4 Billion every year.
A 2025 research on American Water Infrastructure highlights that around 9 million service lines are made of lead. New rules are being enforced to ensure utilities quickly locate and replace these lines within strict timelines.
Against this backdrop, the data side of the business is also moving quickly.
How are Water Utilities Handling Data and Billing Today?
Against this backdrop, the data side of the business is also quickly evolving.
- Smart water meters and AMI networks are replacing once-a-month reads with frequent data and event flags.
- Pressure and flow sensors are being installed throughout District Metered Areas (DMAs) and pressure zones.
- Most medium and large utilities currently use SCADA, GIS, CIS, and work management systems, each of which provides a portion of the operating picture.
In many ways, the central question has shifted from “Do we have data?” to “How do we use this data every day to run our network better?”
These conversations sit at the heart of modern water utility management: combining data across AMI, pressure/flow telemetry, and asset information. Why? To predict problems faster, reduce NRW, maintain water quality, and demonstrate compliance; rather than reporting after the fact.
About This Water Utility Management Guide
In this guide, we will explore the meaning of utility management for US water utilities in today’s landscape. Here, the term does not mean simply customer billing/payment portals, account management or an expense management solution. Water utility management refers to how leading utilities run and manage their networks: managing pressure, flow, NRW leaks, asset maintenance, field ops and regulatory compliance.
Before we discuss frameworks, platforms, and use cases, we need to establish a shared definition. What precisely is ‘water utility management’ in 2026, and how does it differ from traditional methods of operating a water company?
What is Water Utility Management Today?
Water utility management refers to a coordinated, end-to-end management of full water lifecycle management: from source treatment, network distribution, and collection, to optimized resource use. It also involves the effective maintenance of systems and operations, regardless of location, and ensuring communities are served safe, and economically viable water.
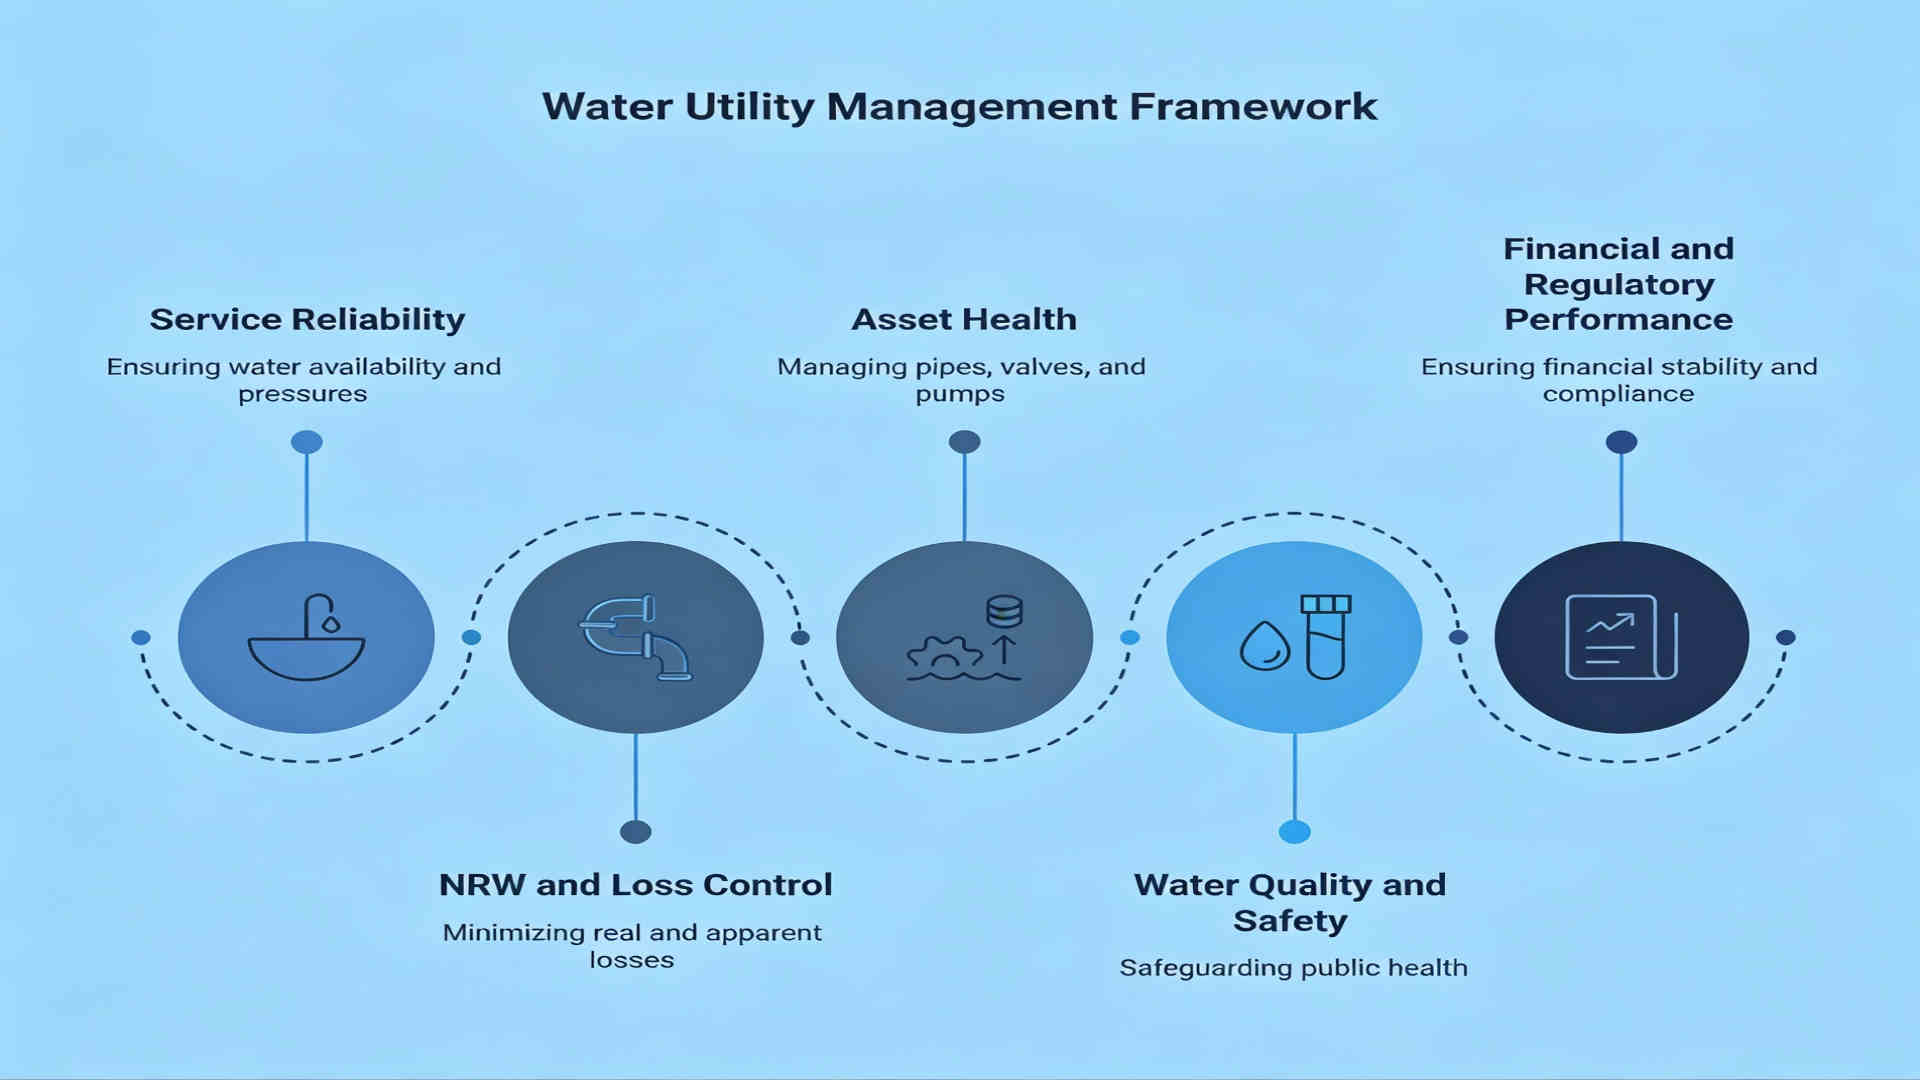
As an end-to-end framework, utility management in water generally includes:
- Service reliability: Ensuring water availability and pressures within acceptable limits for all customer groups.
- NRW and loss control: Minimizing real and apparent losses, ranging from leaks and bursts to metering and data difficulties.
- Asset health: Management of pipes, valves, pumps, reservoirs, meters, and continued treatment of systems to reduce the number and severity of failures.
- Water quality and safety: Safeguarding public health by monitoring dangers (such as lead, backflow, and contamination) and responding promptly to events.
- Financial and regulatory performance: Ensuring recovery of expenses equitably, completing reporting deadlines, and demonstrating successful stewardship to regulators and the public.
It shares common goals with the broader definition of utility management, like operational efficiency, customer satisfaction, and sustainability. However, for water utilities, the goals are set within a specific context: reducing NRW, identifying pressure zones, improving water quality and streamlining distribution networks.
In the next section, we will explore some of the key legislations and governance laws shaping decisions in modern water distribution networks.
How Do Regulatory Norms Drive Compliance in US Water Utility Management?
For US water utilities, day-to-day management is closely shaped by federal legislation, EPA (Environmental Protection Act) enforcement, and state economic regulators. That is why, in today's water utility administration, data evidence and traceability are just as important as pumps, pipes, and workers.
SDWA (Safe Drinking Water Act)
The beginning point is SDWA (Safe Drinking Water Act), which is the primary federal law governing water utility bodies.
- SDWA empowers bodies like EPA to establish minimum health-based limits for pollutants in tap water, and all public water systems must monitor, report, and comply with those requirements.
- Over time, SDWA amendments have included stricter criteria for risk assessment, science-based decision-making, and public communication. This involves utilities now requiring them to demonstrate how they monitor quality and respond when things go wrong.
EPA’s Water Enforcement Program
EPA's water enforcement program ensures that public water systems comply with the SDWA and associated regulations, such as the Clean Water Act. It accomplishes this by evaluating utility data, conducting inspections, and pursuing enforcement action when infractions are not resolved. For water utilities, this translates into highly specific requirements. They should be able to:
- Provide precise, fast, and auditable sampling and lab results for drinking water quality.
- Violations and occurrences must be documented, reported, and corrected within specific deadlines.
- Show clear decision trails, such as why a certain main break was prioritized or how a pressure issue was addressed, knowing that these decisions may be evaluated months or even years later.
PUCs (Public Utility Commissions)
At the same time, state PUCs (public utility commissions) and legislatures serve as economic and policy regulators. State legislatures set and shape PUC mandates, whereas PUCs govern rates, reliability, and investment decisions for many water utilities.
Their judgments on which infrastructure projects receive funding, how resilience and NRW programs are justified, and how rapidly new technologies like AMI and telemetry are adopted.
When used collectively, this architecture delivers a strong message:
- Water quality, reliability, and affordability are regulatory requirements, not voluntary goals.
- Utilities must be able to demonstrate, using data, that they manage risk, respond to incidents, and are investing wisely.
The next step is to understand why operating a modern water network has grown more difficult over time, and what that means for utility management in practice.
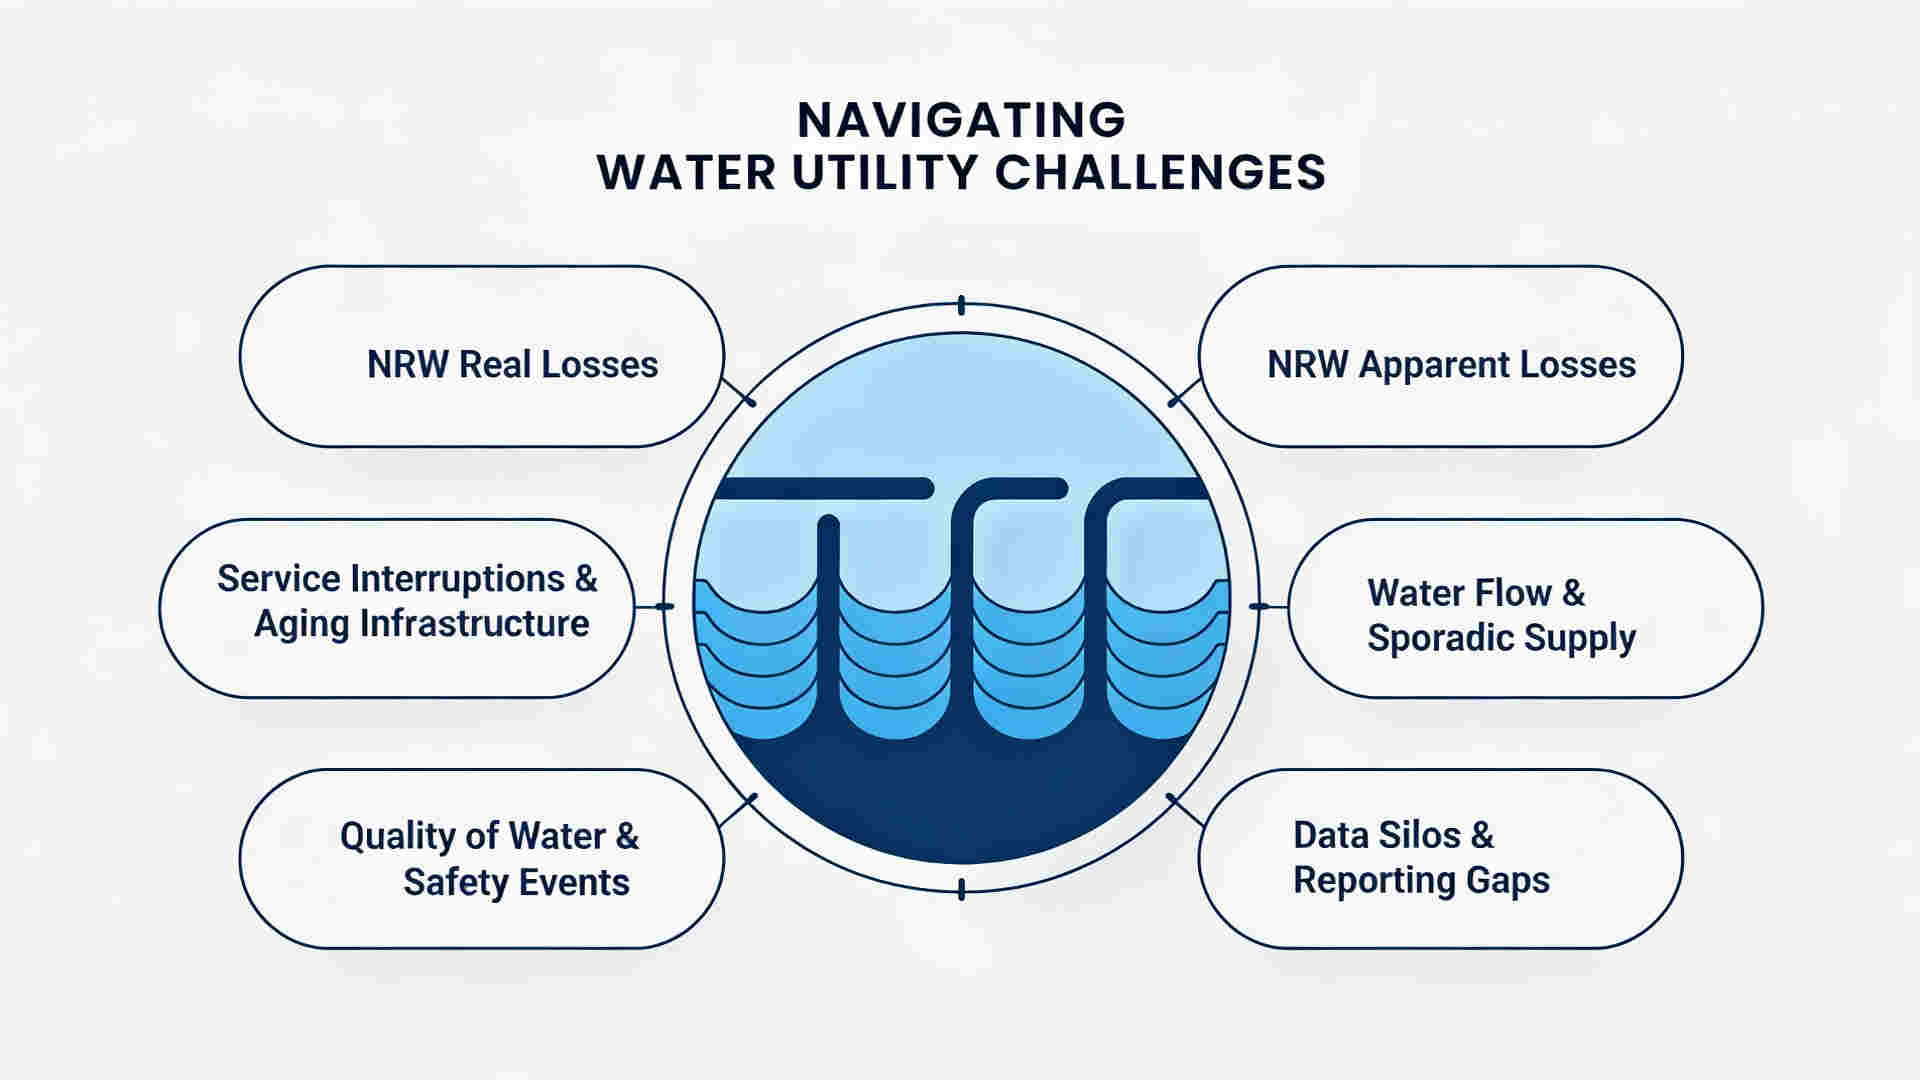
What are the Biggest Operational Challenges in Water Utility Management Today?
Non-Revenue Water (NRW) Losses
For most water utilities, NRW or non-revenue water is the most obvious indicator of network stress. NRW losses generally fall under two categories:
- Actual Losses: Physical leaks, bursts, overflows, and pressure-related leakage.
- Apparent Losses: Meter inaccuracies, data gaps, unauthorized use, and errors between metering and billing.
When almost one in five gallons of treated water are never delivered to a paying customer, both financial performance and regulatory trust are compromised. High rates of NRW losses raise concerns about how well a network is being managed. It also becomes harder for water utilities to defend rate cases and capital plans.
To move beyond static annual NRW numbers, modern utilities are leaning on AMI data, DMA(District Metered Areas) level views and leak analytics. The goal is to achieve real-time, zone-level insights that will support targeted interventions, instead of reactive fixes.
to transition from static annual loss numbers to receiving continuous, real-time, zone-level insights, and supporting targeted interventions.
Service Interruptions, Breaks, and Aging Infrastructure
Pipes, valves, and pumps that have been buried for decades still carry most of America’s drinking water. According to the 2025 ASCE infrastructure assessment, drinking water continues to receive below-average grades, with aging assets driving frequent main breaks and growing replacement needs.
Drinking water systems lose 2.1 trillion gallons annually, and the rate of water main breaks increased by about 27% between 2012 and 2018. In practical terms, that means roughly 250,000–300,000 breaks each year; or about one break every two minutes.
If left unaddressed, these issues turn into more emergency repairs, rising operating costs, and difficult decisions over where limited capital should be deployed first. Many asset-related decisions still rely on complaints or rough rules of thumb about “worst” pipes, instead of a clear, risk-based view of the network.
Water Flow, Pressure, and Sporadic Supply
Even when water quality is good, unstable flow and pressure can undermine customer confidence and increase losses. Common patterns include:
- Pressure zones that create pockets of low or excessive pressure
- Intermittent supply that introduces air, causes discoloration, and raises intrusion risk
- Slow detection of chronic pressure issues that drive background leakage and premature asset failure
Today, effective management of water utilities depend on flow and pressure telemetry, so that they can maintain pressure within target bands. Also, it helps them spot little anomalies before they escalate into major issues.
Quality of Water and Safety Events
Water quality and safety events such as backflow, contamination, or treatment failures can have severe consequences. They can damage assets, erode public trust, and lead to regulatory penalties. When these events occur, utilities should be able to:
- Detect abnormal patterns quickly
- Isolate affected areas within the network
- Communicate clearly with customers and regulators
- Document every step taken, from detection to resolution, for audits and internal reviews
Meeting these expectations requires utility management approaches that bring together quality data, operational events, and field actions into one traceable workflow, rather than scattering them across separate reports and systems.
Data Silos and Reporting Gaps
Most water utilities deal with a multitude of systems and components, such as SCADA, GIS, CRM, IoT sensors, etc. Now, each of these systems are designed to perfectly work on their own. However, they seldom work together to produce a single operational view. This often leads to:
- Fragmented insights, with each team able to see only a portion of the full picture
- Time consuming work in creating NRW reports, incident logs and records for audit
- Challenges in answering queries like ‘where exactly are we losing water, and how quickly did the team respond?’
To address the above issues, utilities require software that connect the existing stack and new platforms within the network, instead of yet another silo.
When viewed together, these challenges explain why water utility management cannot be simply limited to “keeping the pipes and plants running.” The definition now must include bringing data, assets, people and compliance into a connected, data-driven environment.
How Can Water Utilities Build a Practical Framework for Digital Water Utility Management?
By now, it has become clear that utility management in water cannot rely solely on manual processes, systems and reactive approaches. Many US utilities already have smart meters, and other work management tools in place, or are already planning them. The real challenge here is turning all that patchwork into a coherent operational backbone. One that helps run the network smoothly in real time, and not just report what happened last month.
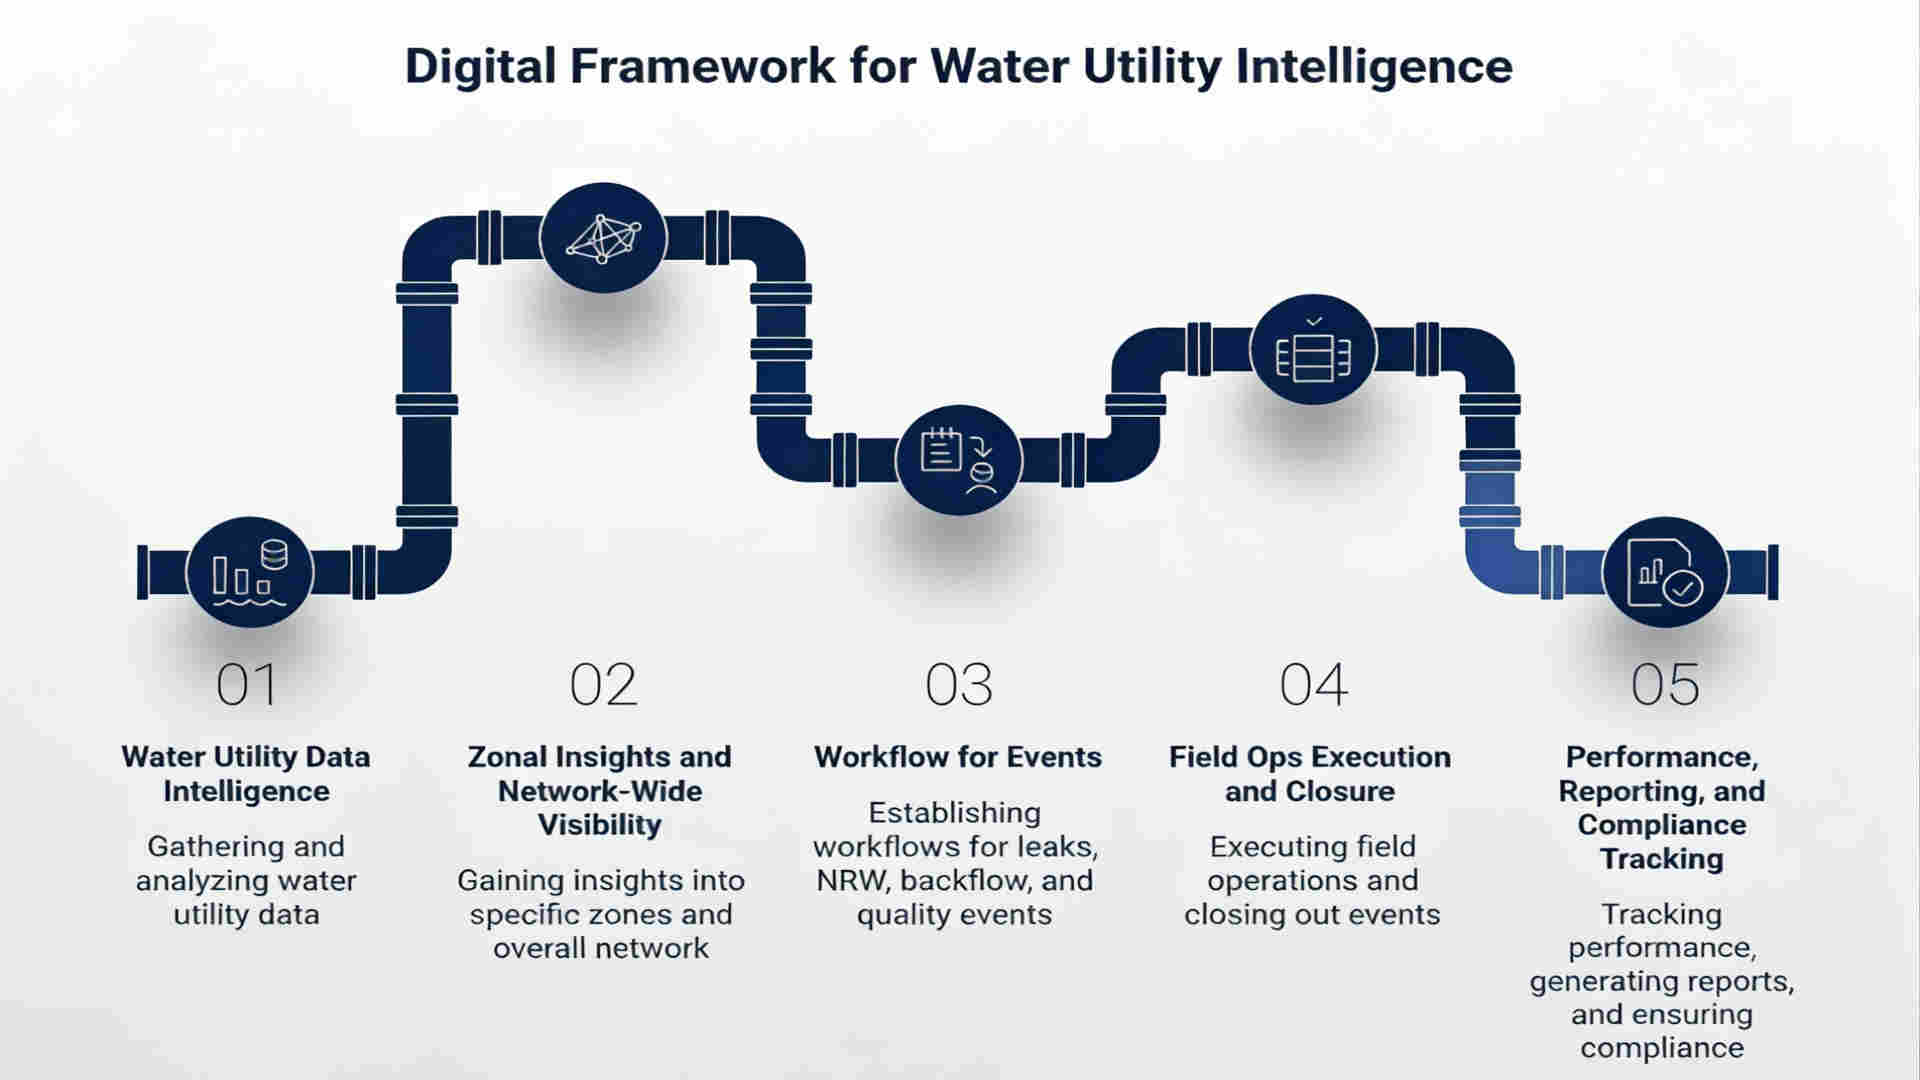
A hands-on approach to manage digital water utility networks should generally follow a five-step framework. Let’s explore each of them in detail.
Step 1: Water Utility Data Intelligence
The foundation should not be ‘more data’, but ‘better data.’ For any contemporary water utility, this entails combining:
- AMI events and readings (continuous flow, leak, backflow, tamper)
- DMAs and key nodes that provide pressure and flow telemetry
- SCADA signals, work management history, GIS network models, and CIS customer data
Data intelligence is all about making this information usable. It generally involves eliminating gaps and duplicates, placing assets and meters in the proper zone, and identifying stale intervals or silent meters. When this layer is weak, NRW analysis, leak detection, and regulatory reporting becomes speculative. If it is strong, then every other aspect of managing a water utility becomes easier.
Step 2: Zonal insights and network-wide visibility
Once data is cleansed and normalized, the next step is creating a live image of the system. In practice, this would appear as:
- DMA and pressure zone dashboards that display losses, pressure, and demand
- NRW, burst, and complaint heatmaps by region
- Basic communication health indicators, such as the proportion of meters and sensors that are reporting
This level of visibility alters the type of conversations in board and control rooms. Leaders can see where water is being lost, which zones are under stress, and where to send field work first, rather than arguing over anecdotes and partial reports.
Step 3: Workflow for Leaks, NRW, Backflow, and Quality Events
Visibility is only beneficial if it leads to prompt action. The third step is developing clear workflows that turn events into work, not mere alarms.
Some real-life examples include:
- A continuous flow pattern at night automatically creating a suspected leak ticket
- A backflow event leading to a high-priority investigation is created based on pre-determined playbooks
- A series of low-pressure incidents auto-triggering checks for a potential main break or valve problem
Every workflow must include specific contexts: location, impacted clients, asset history, and recommended next steps. Priority rules based on location proximity, severity of risk and critical customers will ensure that urgent issues get addressed first. At this point, digital water utility management begins to feel different on the ground because critical events simply do not vanish into an alert list.
Step 4: Field Ops Execution and Closure
In this step, the control room gets connected to field operations. Rather than phone calls or paper forms, crews now receive digital work orders that include:
- Exact location and access details
- Reasons as to why the ticket was raised (backflow, leakage, data mismatch)
- Notes for safety and details of nearby customers
When crews arrive on the field, they capture pictures, notes, materials used and note asset/meter changes on-site. All of this happens using utility management platforms that are designed for both control room and frontline operations. As they close the tasks, the status flows back automatically, updating reports/dashboards and workflows in real-time. Over time, this reduces duplicate visits, missed follow-ups and ‘hidden fixes’ incidents that only supervisors know about.
Step 5: Performance, Reporting and Compliance Tracking
The final step involves using the same data and workflows to meet regulatory guidelines, and internal targets. A streamlined water utility data management approach enables utilities to:
- Track NRW trends by zone and cause (real vs apparent losses)
- Measure performance against internal SLAs for events like repair, backflow response and quality-related incidents
- Create audit-ready records that highlight in detail where an event was detected, who acted upon it and what was the resolution
Instead of scrambling through excel sheets every quarter and across systems, utilities can respond to any critical query in a matter of minutes.
The key to success with this digital framework is treating water utility systems as parts of a coherent network, not as isolated projects. In the next section, we explore what to prioritize when investing in a utility management solution that can support the above framework.
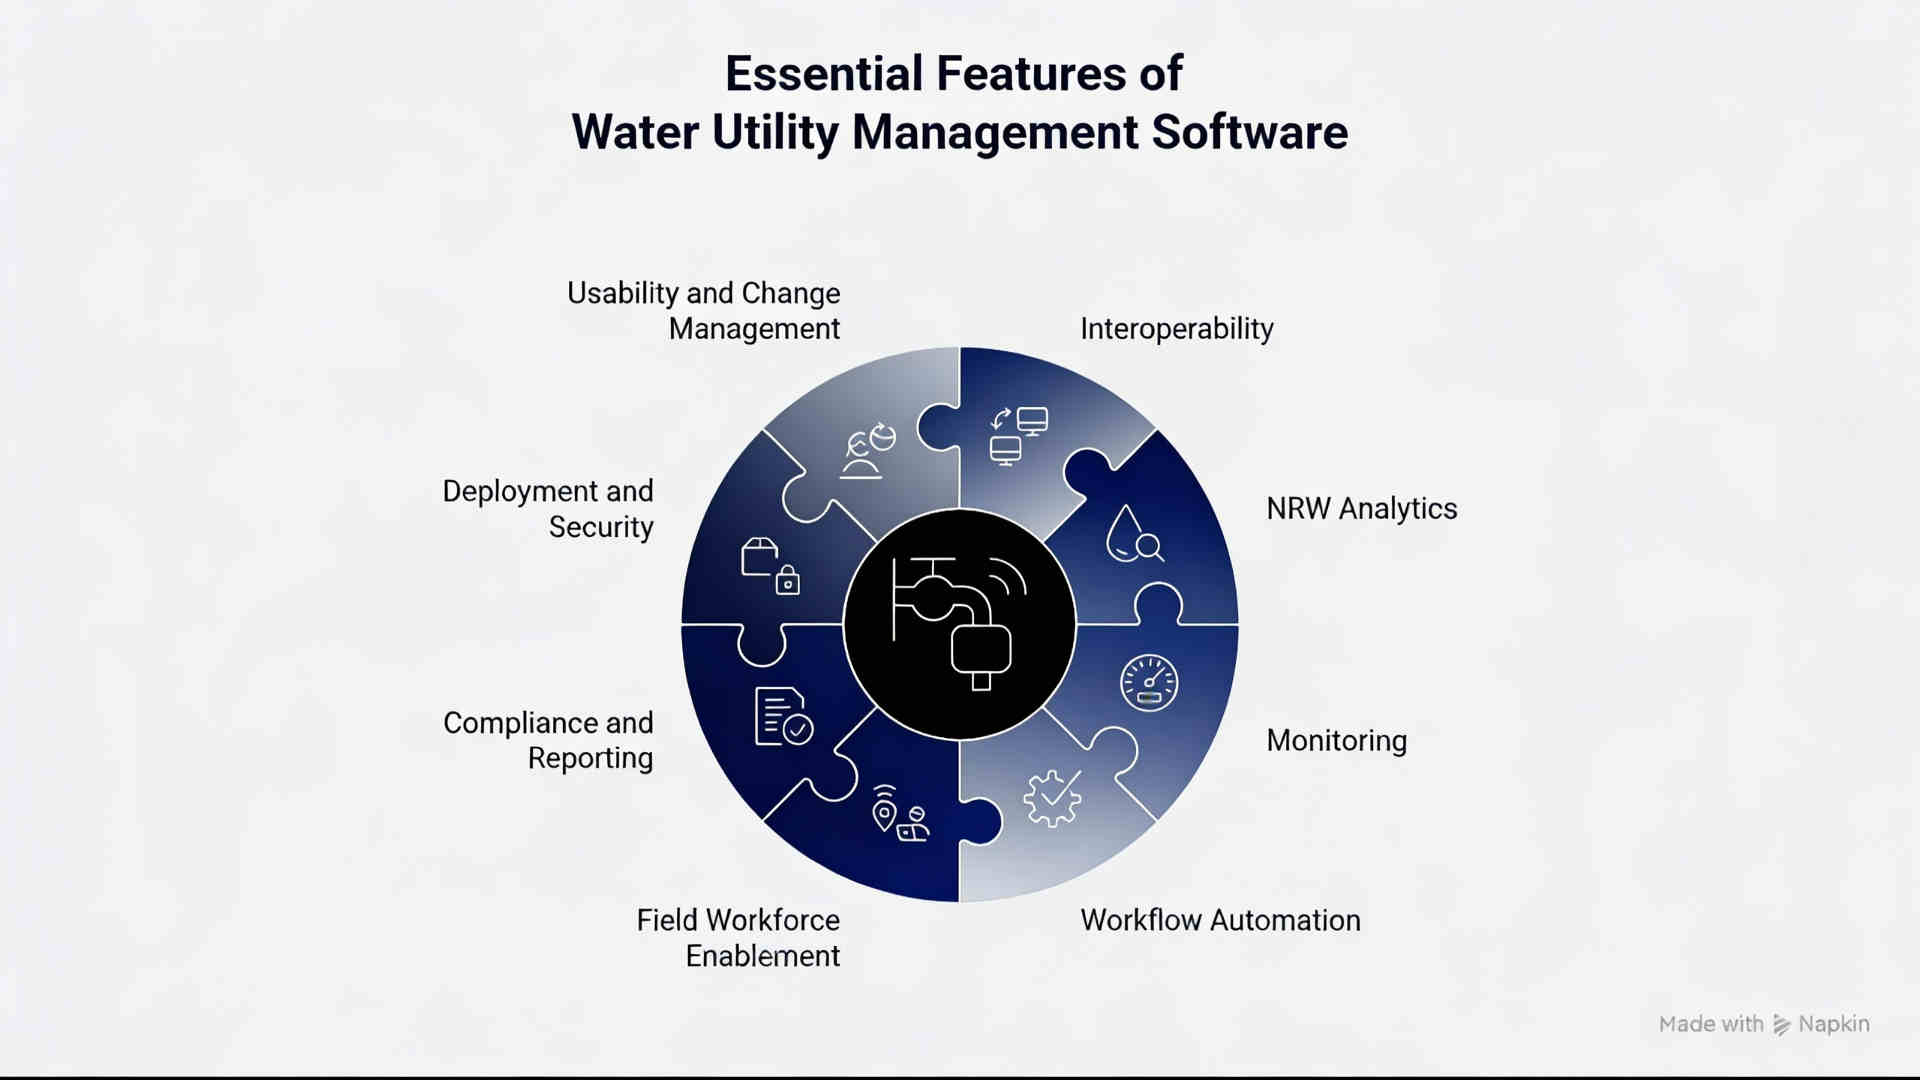
What Features to Look for in a Water Utility Management Software?
We have already discussed what reliable utility management for water networks should look like. The next question is, ‘what kind of solution or platform can actually support it?’ The goal here is not to add another point solution, but to place a comprehensive system on top of the existing utility stack and help data, field ops and workflows to run as one.
Interoperability with existing systems
The solution should connect seamlessly with AMI, GIS, CIS, and work management tools. In practical terms, this means having standard integration capabilities, robust APIs, and ability to handle multi-vendor projects with ease without forcing a rip-and-replace project.
NRW analytics that go beyond reporting
An ideal utility management solution should support both pattern and threshold-based detection with DMA-level NRW insights. Utilities should be able to move from annual NRW reports to real-time monitoring and perform targeted leak reduction initiatives.
Built-in monitoring for pressure, flow and backflow
Every event, such as backflow, or pressure flow must be treated as first-class signals, and not as secondary metrics. . This means using these signals to trigger actions or decisions in the same way as it happens for leak alerts. Modern systems should also support event-based alerts that auto-create workflows, enabling operators to view each event with details like affected customers, zones and asset history.
Workflow automation and orchestration
Every utility needs a clear roadmap: event → ticket → prioritization → dispatch → closure. And all of these steps need to be embedded with SLAs which they can track. Also, workflows should not be hard-coded but configurable, so that utility teams can adjust rules as per network and evolving policies.
Field workforce enablement
Field teams require tools that support mobile work orders, offline capabilities, routing and proof-of-work capturing (images, notes). This is where checks for repairs, backflows and quality response actually take place. Therefore, the UX of the platform must work for the field crew, and not just for data analysts.
Compliance, reporting and audit trails
A water utility management platform should make it easy to produce NRW reports, and incident logs. Additionally, it needs to streamline the process of maintaining audit-ready records as to when events were detected, who acted upon it and what actions were taken. Other key essential features ‘to-have’ include exportable reports for boards, regulators, and internal reviews.
Deployment, security and governance
Modern water utilities also have to deal with strict IT requirements. When evaluating a potential solution, one must look for platforms with on-prem, cloud or hybrid options. Capabilities like role-based access controls, logging, and governance, must also be embedded so that any changes or updates are fully traceable.
Usability and change management
Even the most advanced system fails if people do not use it. Platforms should prioritize configurability, rule libraries, templates, and training programmes that help operators, engineers, and field teams adopt the system in phases.
If you’re a utility leader comparing different options, it might be useful to pair the above checklist with a broader view of your existing cross-utility stack. For a wider perspective, you can refer to our detailed guide on how to select the right utility management solution and map where water-specific requirements fit into your overall operations and strategy.
How Does Water Utility Management Work in Real-World Use Cases?
Utility executives often find it easier to interact with a framework or a solution when they can see what it looks like in practice. This section demonstrates a real-life demonstration of utility management for a water distribution network. It explains how a real-life case study on how smart meter data, workflows, and field operations worked together to lower NRW losses and safeguard revenue.
How Can Data from Smart Meters Help Lower NRW and Protect Revenue?
In a large-scale undertaking, a water utility implemented a meter-data-driven operations layer on top of its AMI network. The project involved monitoring over 480,000 smart water meters for residential, commercial, and industrial customers.
The objective was to move from periodic NRW reports to real-time monitoring and support targeted interventions.
- The first step was attaining data intelligence. AMI reads, leak and backflow flags, and cadence data were integrated into a unified view. By tracking which smart water meters reported on time, which ones had stale intervals, and which belonged to high-risk segments, the utility could quickly detect areas where data was incomplete or unreliable.
- On top of this, they also developed NRW and leak analytics. Rules were adjusted for various segments; such as abnormal profiles for industrial sites, pattern-based detection within DMAs, and night-time continuous usage for residential customers.
- Within the first 72 hours, the system found 35,671 m³ of leakage and flagged 95,430 devices for further examination. This provided the water utility with a concrete starting point for further field research.
- At the same time, both data quality and revenue protection were strengthened. The water utility management solution detected meters that were clearly consuming water but not connected to any active customer accounts. Over the same 72-hour period, the platform revealed 309 unmapped meters, with up to 86 m³ of consumption associated with these devices. In normal scenarios, this volume would not have been billed otherwise.
- The project also addressed backflow and safety incidents. Instead of treating reverse-flow patterns as mere anomalies in a SCADA chart, they were now tracked as first-class operational signals. After detecting persistent back-flows, the system created high-priority tickets with location, asset history, and a standard investigation checklist. Over time, this also provided the utility with a clear digital audit trail for each event, right from detection to closure.
This single deployment alone does not solve every aspect of water utility management challenges. Other key areas like burst prediction, pressure management, and long-term asset management may still require additional layers. The real-life use case does highlight how a digital approach to utility management turns meter data into actionable workflows; and how fast measurable results appear when data intelligence, visibility and field execution are aligned.
How do Water Utilities Move from Concept to Execution?
Water utility management today sits at a critical intersection, integrating data, regulatory adherence and day-to-day operations. For utilities, the way forward does not begin with investing or buying another system. It starts with a clear view of where they are today:
- How trustworthy is their telemetry data?
- Do teams across billing, field crews and back office rooms share a unified view of leaks, events and non-communicating meters?
- Can they trace events, from detection to closure, if a regulator asks months or years later?
Once the above boxes are ticked, most utility enterprises will then begin to take a staged approach.
- Strengthening data intelligence and zonal visibility, so NRW and pressure issues are visible by zones
- Building and refining a small set of high-value workflows, such as unmapped meters or continuous flow leaks
- Connecting field operations and reporting, so every ticket and inspection feeds back into planning, compliance and investment decisions
If you’re already collecting meter and pressure data but still relying on spreadsheets and anecdotes to run the network, you’re not alone. Scheduling a quick demo with the Grid team can help you benchmark where you are today and see what similar utilities have gained in lower NRW, faster incident closure, and clearer audit trails.

.jpg)
.jpg)
.jpg)


