

About
Detailed Case Study
At a Glance
Key challenges faced by the utility:
Disconnected smart meter data: Two separate MDM systems covered roughly 700,000 meters, so consumption reads, telemetry and event data stayed siloed and every decision meant manual work across tools.
Blind spots in transformer health: With no temperature sensor data, deterioration went unseen and inspections only happened after a complaint or failure, not before.
Outdated tariff categories: Consumers stayed on tariff and sanctioned-load categories that no longer matched actual usage, leaving revision candidates hidden.
Scattered operational data: Answering even a simple operational question meant checking multiple systems, exporting data and piecing it together by hand.
Grid in Action (How It Was Implemented)
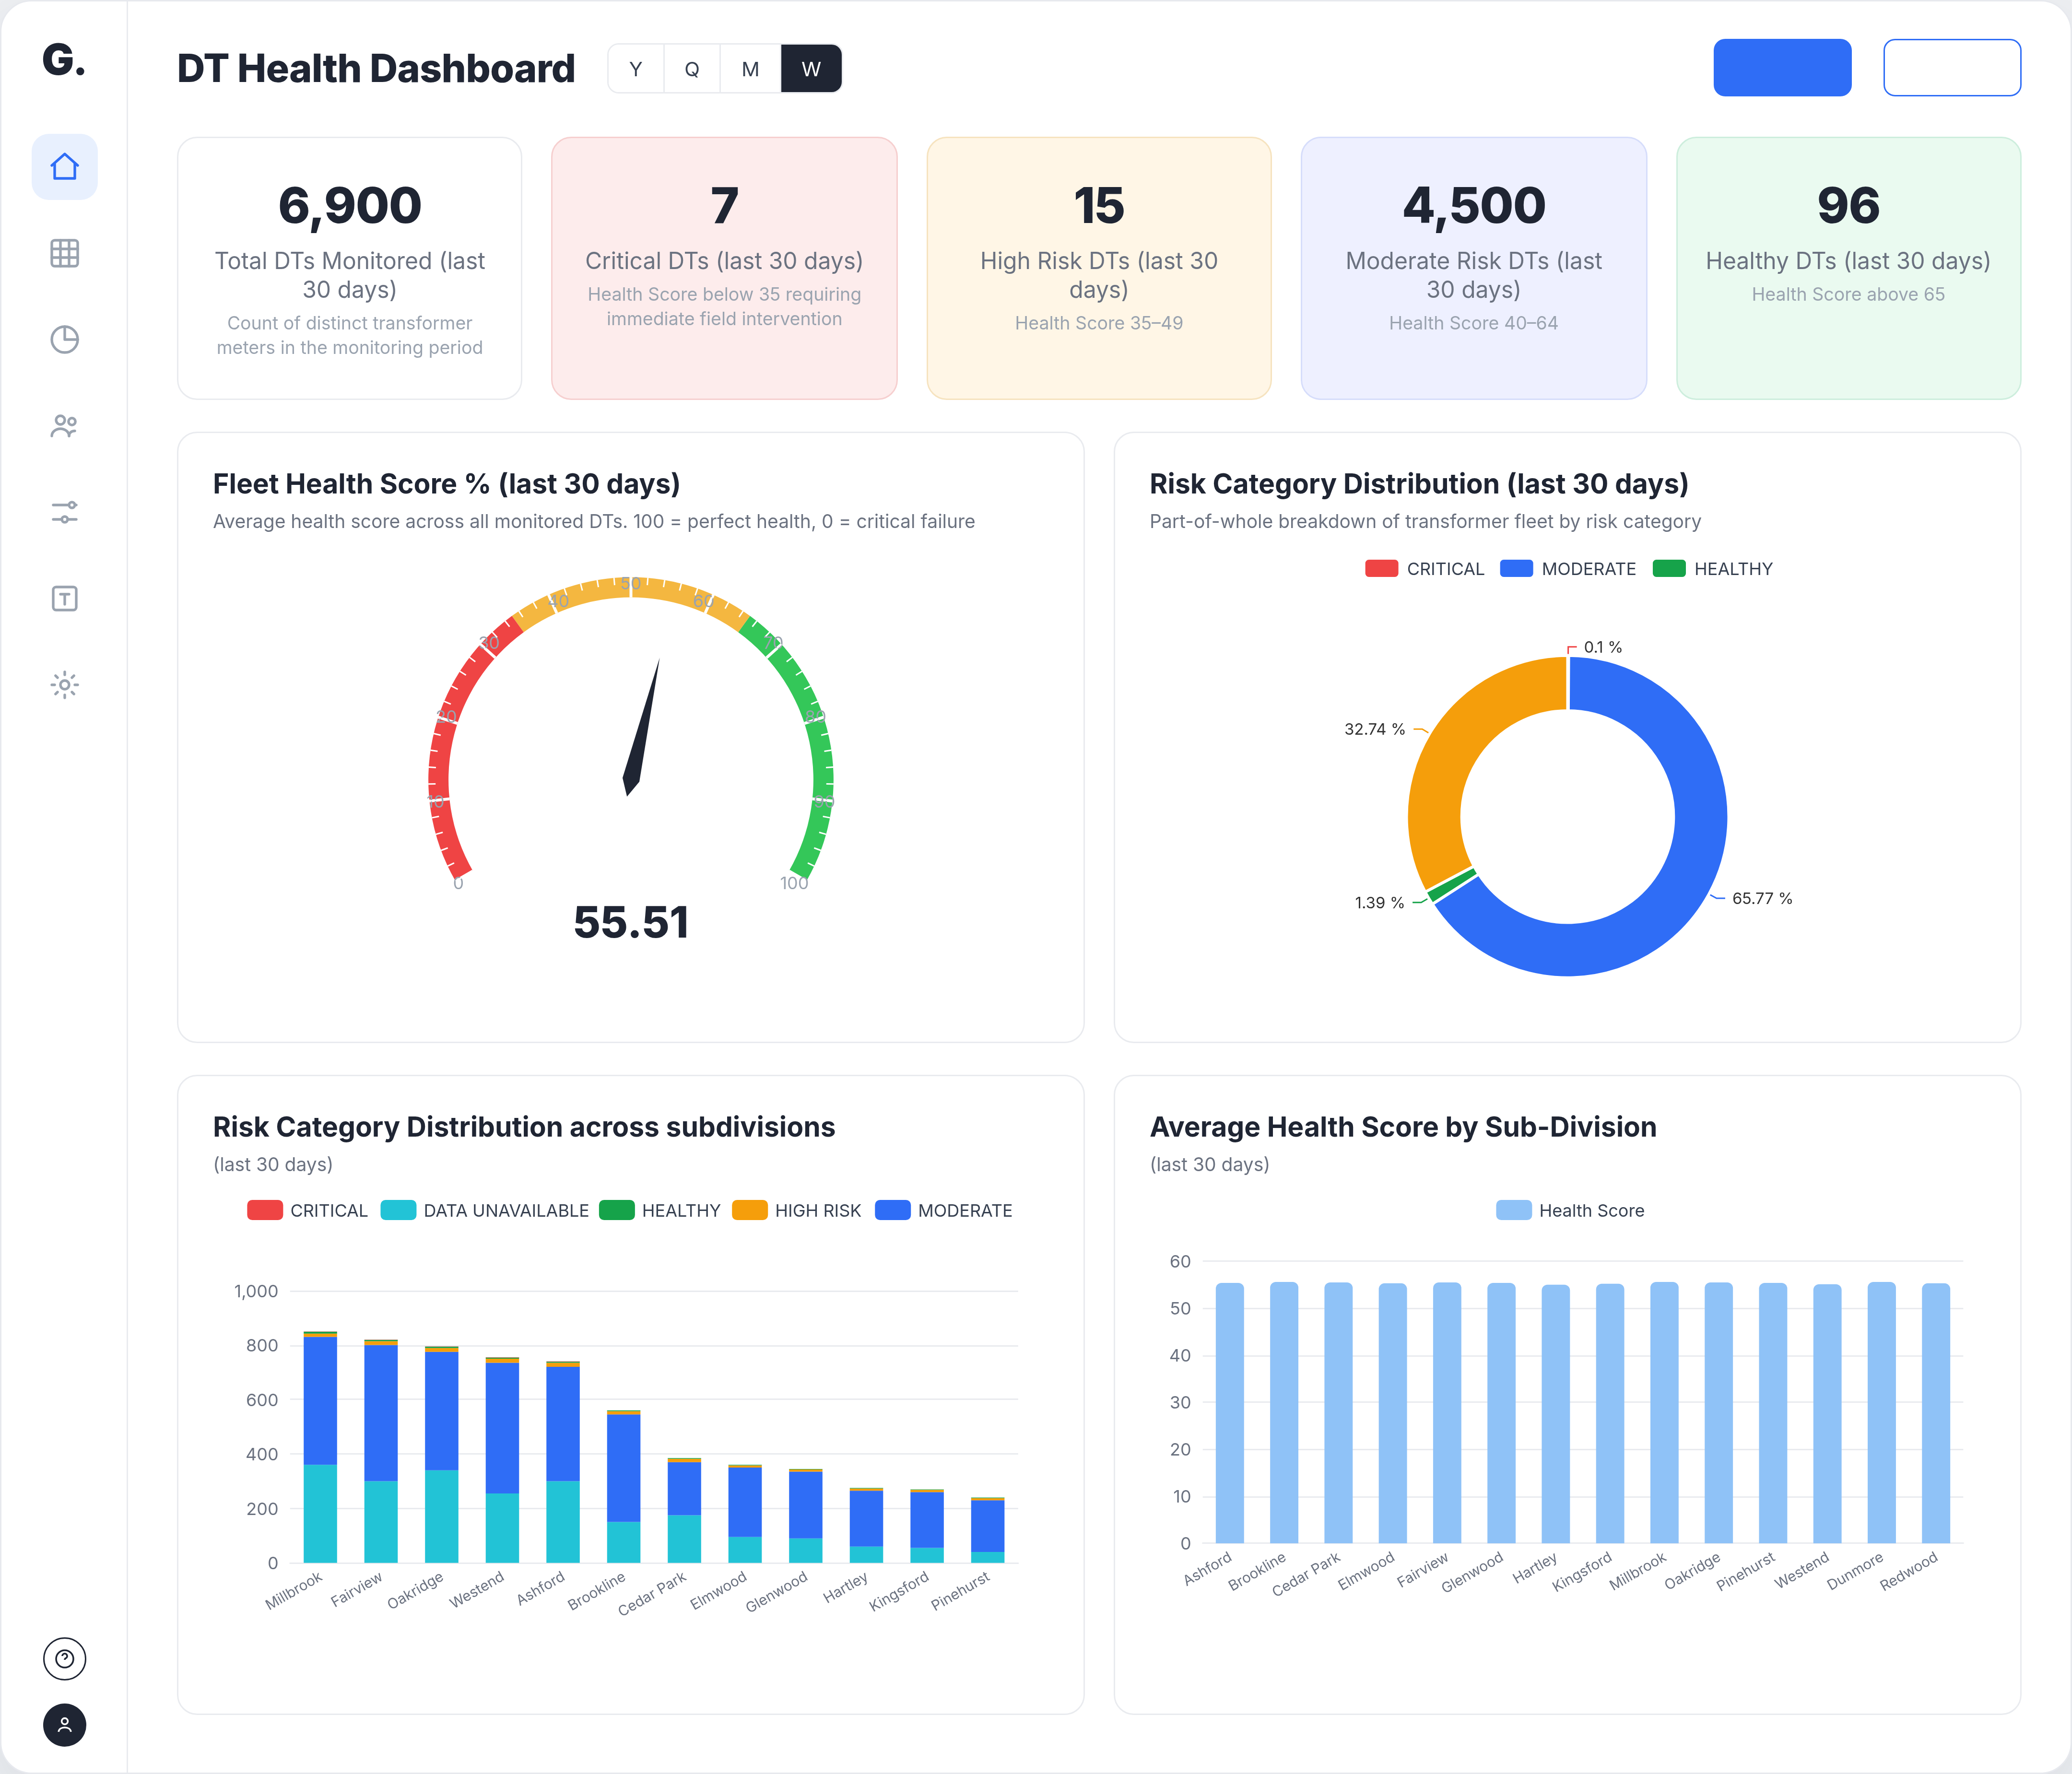
Transformer health monitoring
Every transformer is scored 0–100 on overloading, phase imbalance, ageing and outages, giving maintenance teams a ranked worklist with the primary reason attached instead of waiting for failures.
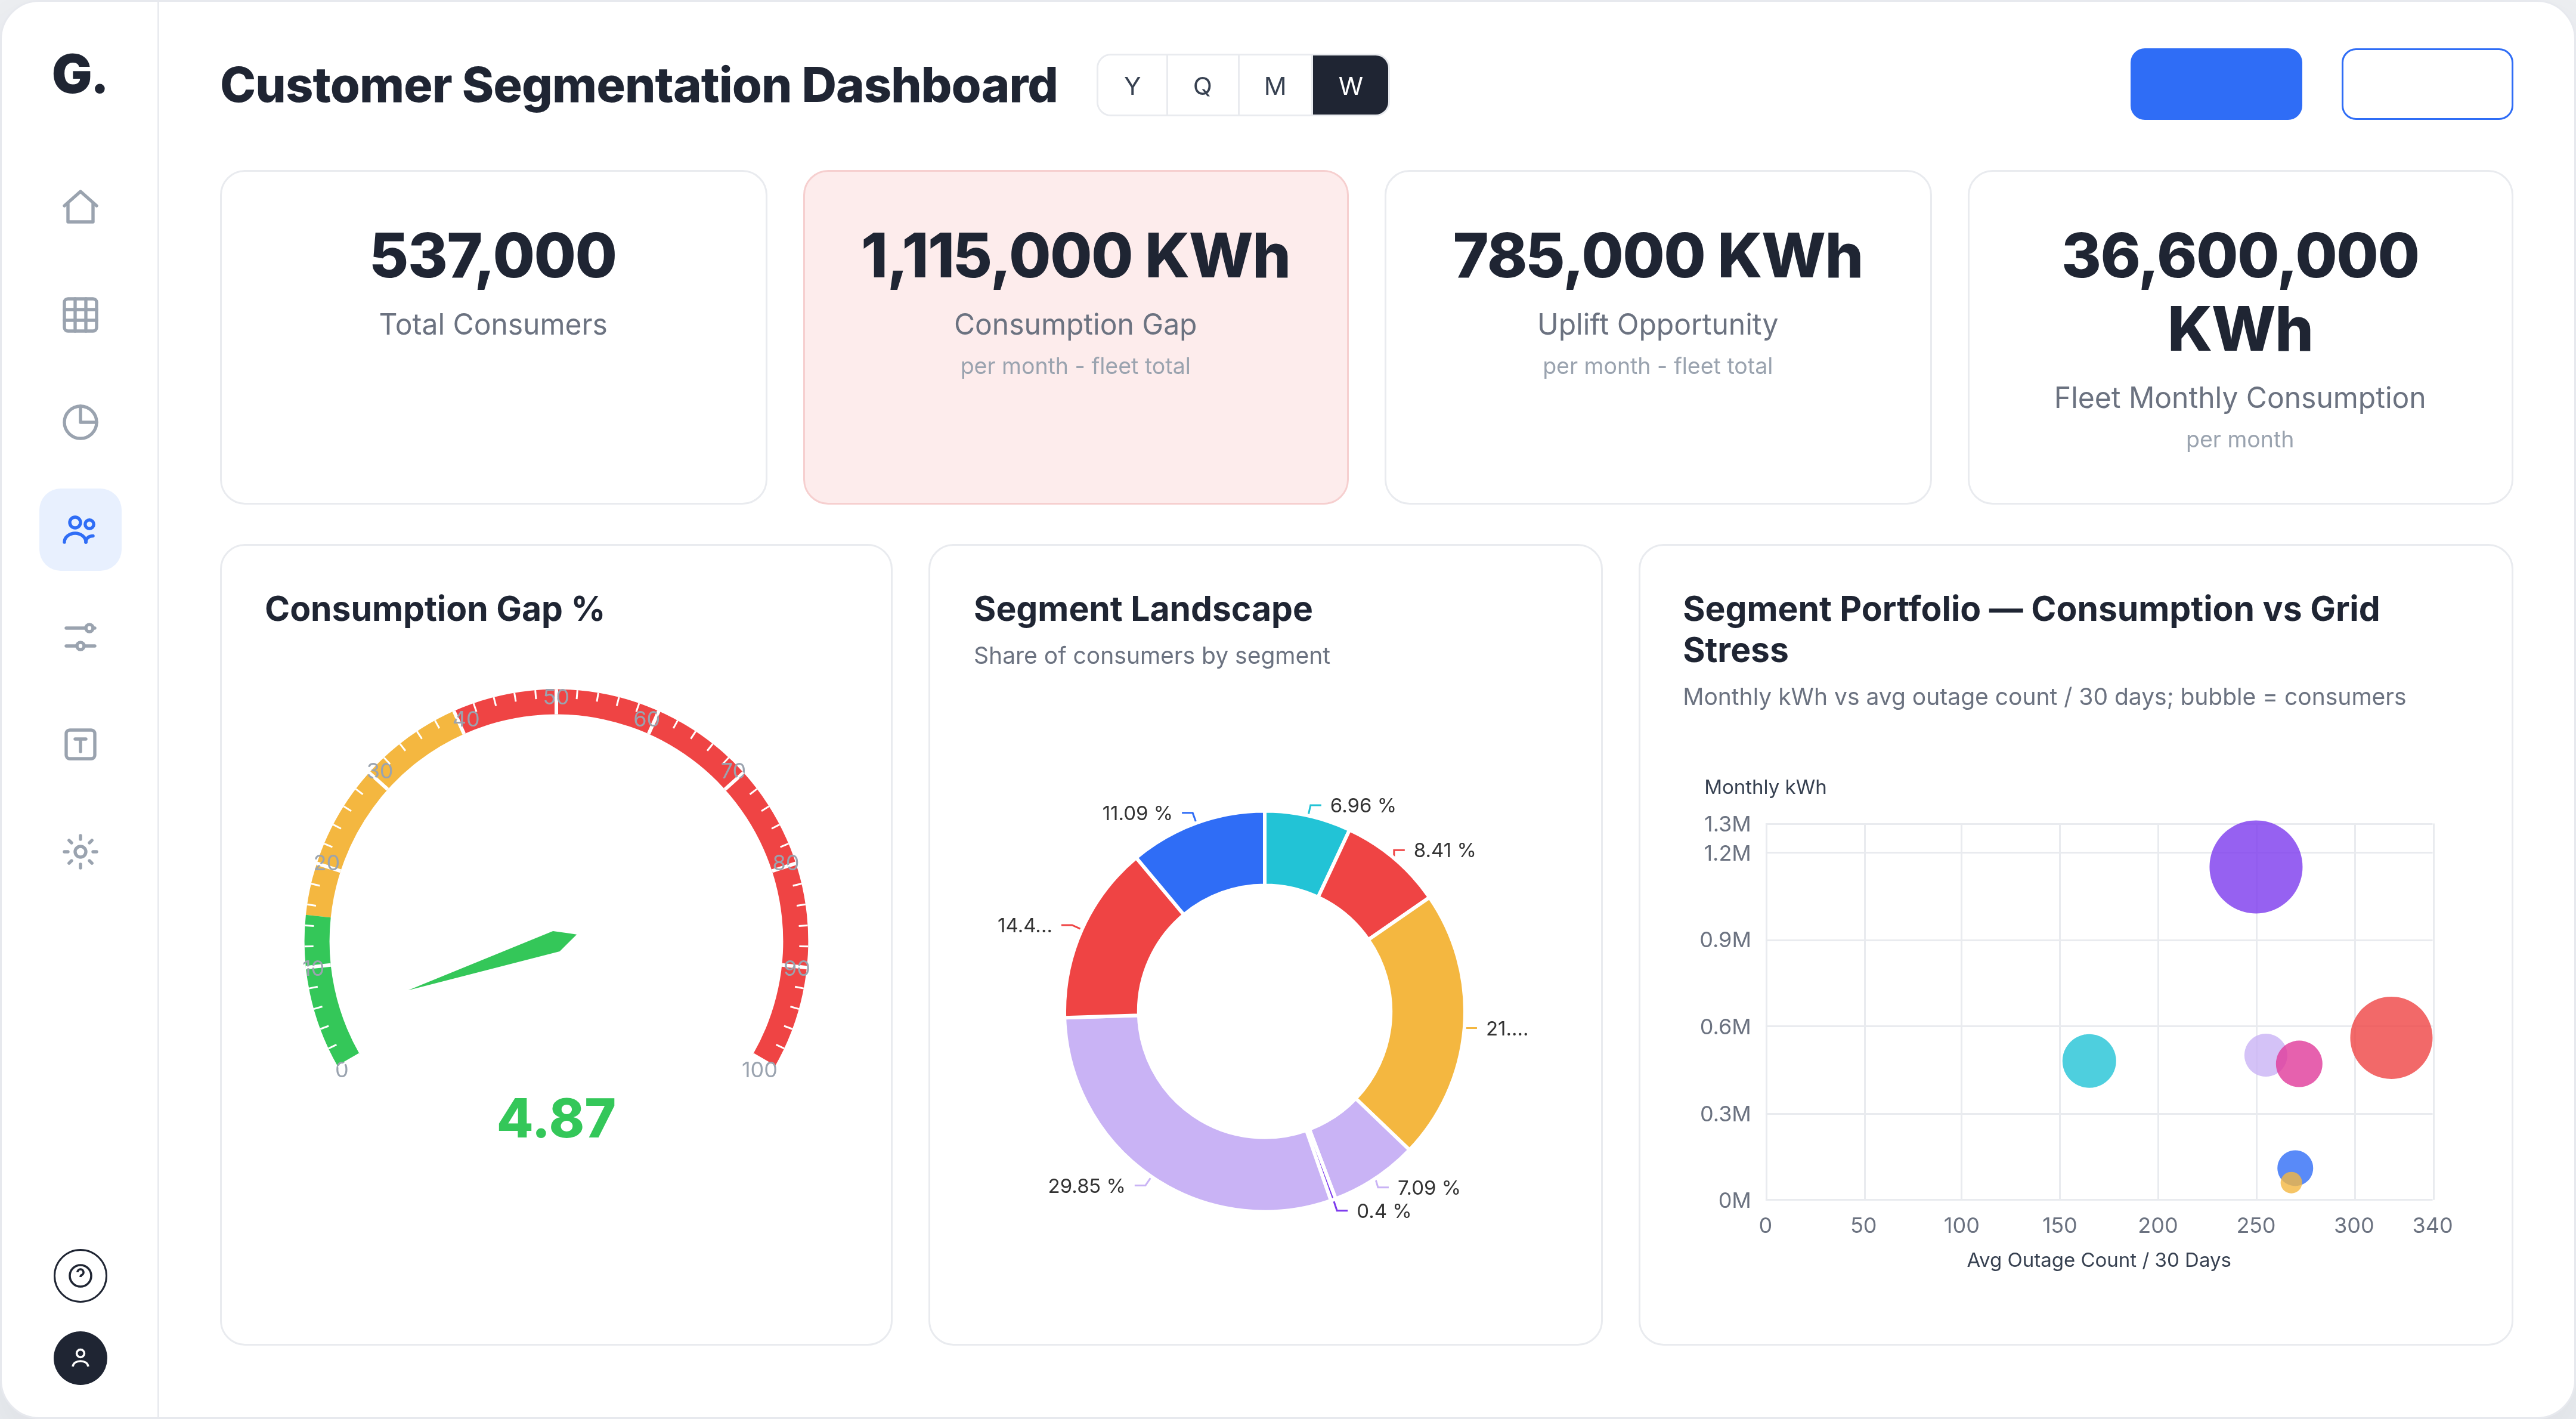
Consumer segmentation
Nearly 640,000 consumers are sorted into eight operational segments, surfacing tariff and sanctioned-load review candidates that were previously invisible.
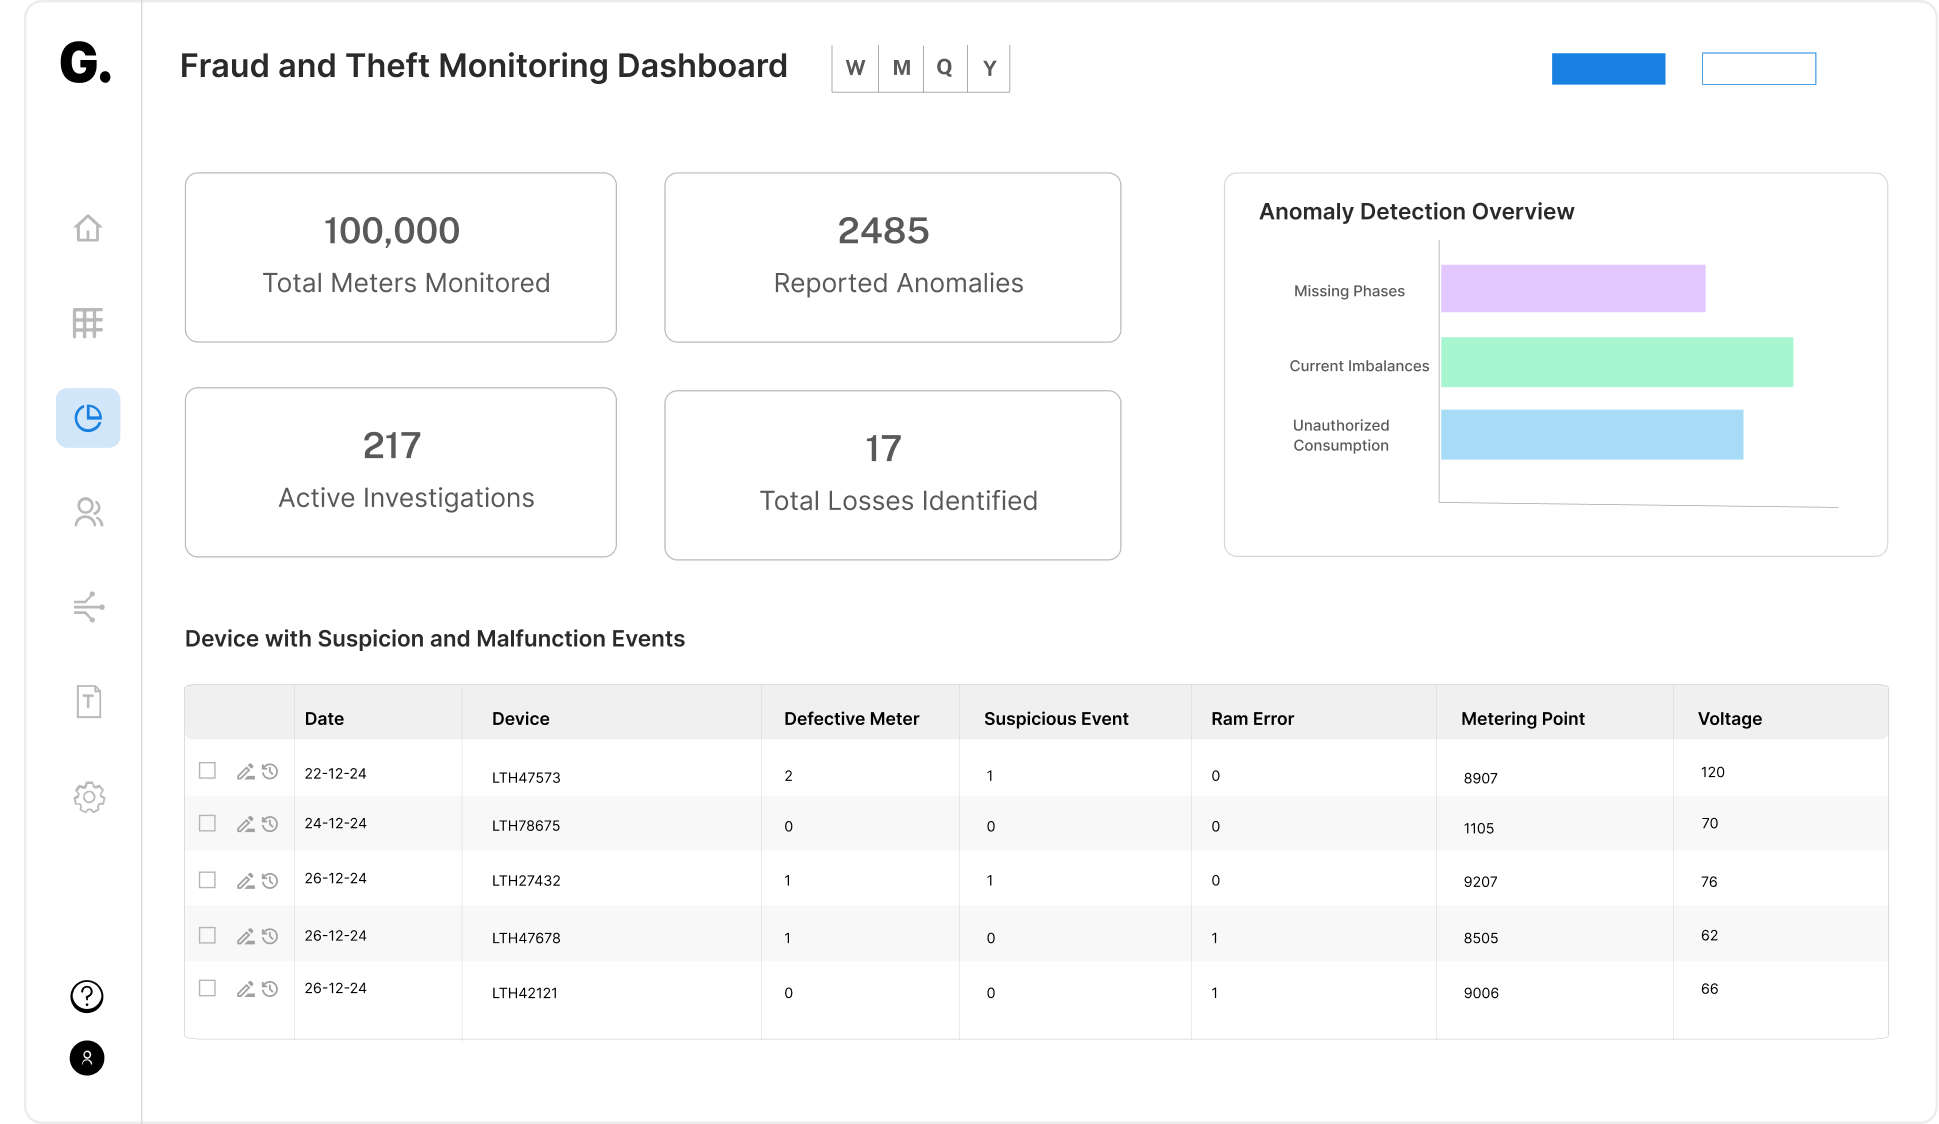
Fraud & theft detection
Suspect meters are scored on five independent checks and ranked into a prioritised queue, treated as leads for investigation rather than proof of theft.
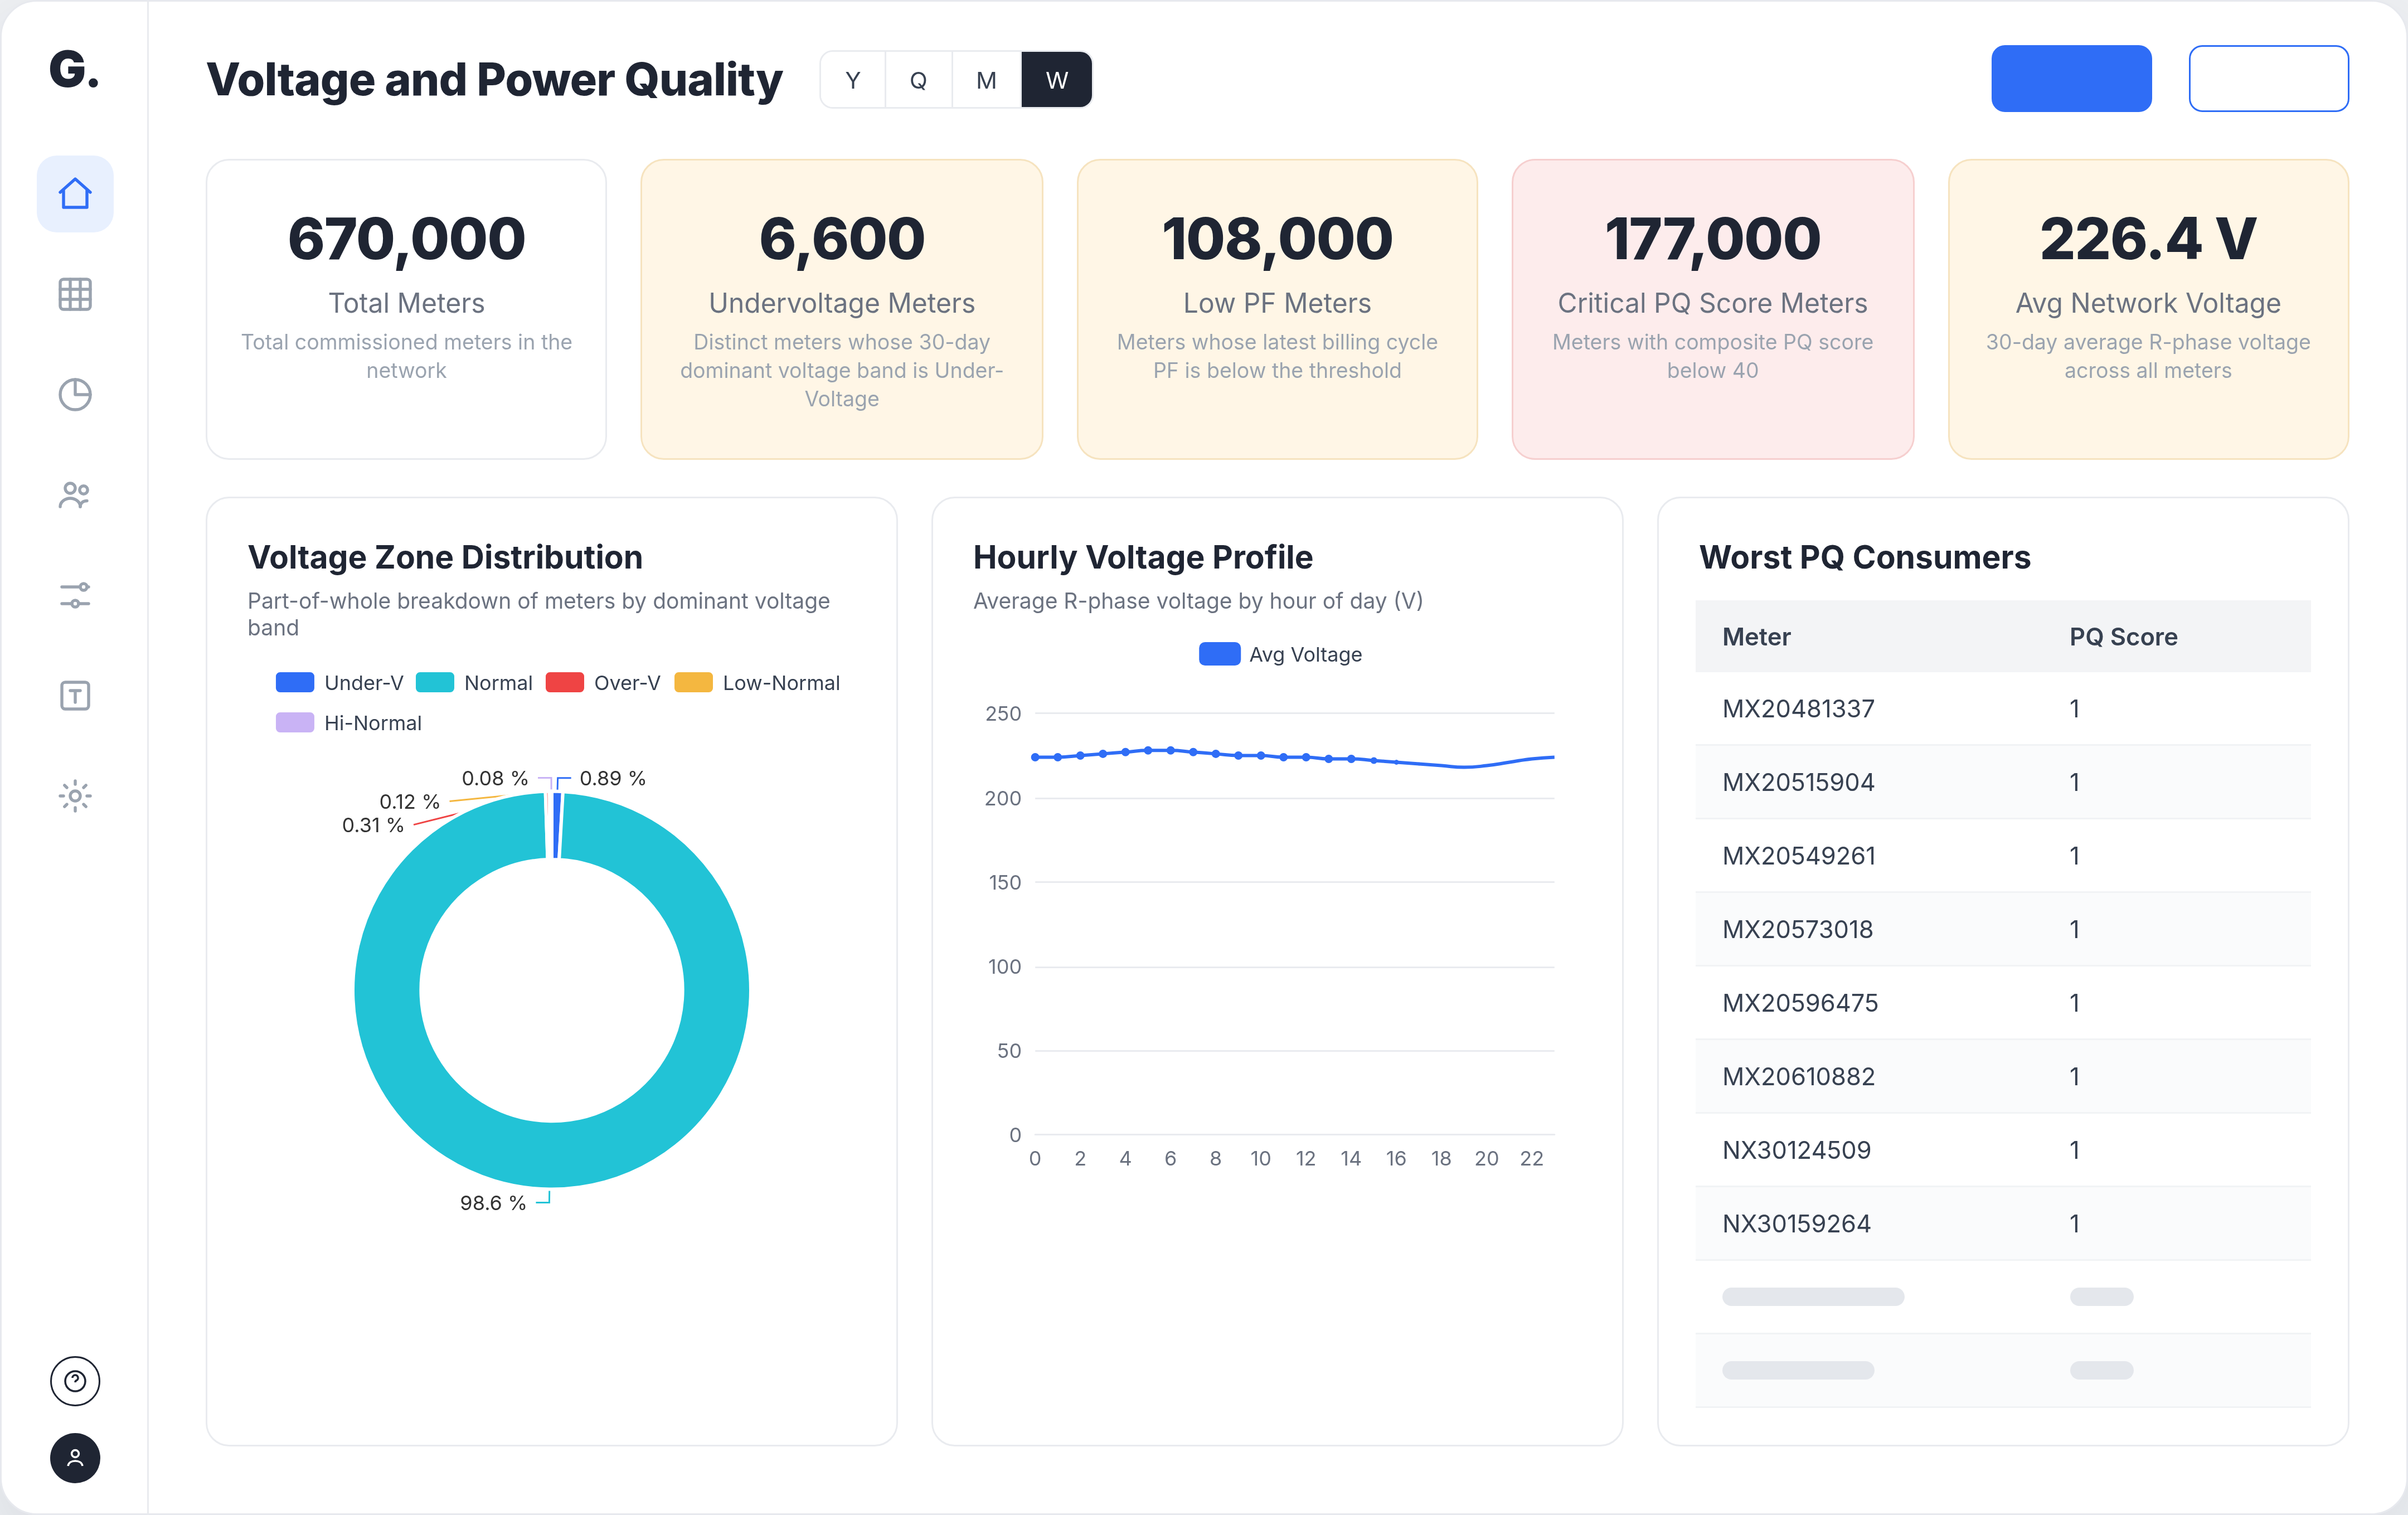
Voltage & power quality
Each meter carries a per-phase 100-point score, and for three-phase meters the worst phase drives the result, so one degraded phase is never masked by the others.
Applied AI: Conversational Intelligence
Teams query meter, transformer and event data in plain language, by chat or voice, without switching between systems.
Grid in Numbers
- 11 / 12 deteriorating transformers caught and verified in the field before failure
- 6,000+ transformers under continuous health scoring, feeding a prioritised field worklist
- 14,000+ meters marked for action within 24 hours from a ranked revenue-protection queue
- 1,300+ MWh monthly consumption gap quantified across nearly 650,000 consumers
- 98.6% voltage compliance baseline established across ~680,000 meters, tracked per phase
See how Grid is the trusted digitisation partner for CIO’s & IT Teams at Utilities

Related case studies

How a Power Utility achieved 95% Consumer-to-DT mapping accuracy with Applied AI
A leading power utility managing 7 lakh smart meters found that 42% of its consumer-to-DT mappings were incorrect, affecting DT-level energy accounting and loss analysis. Using Applied AI, the utility improved mapping accuracy from 58% to 95%, a 37-percentage-point increase, with the ability to update mappings as the network changed.
Applied AI: Unifying 700,000 Smart Meters into One Analytics Platform for a Leading Power Utility
See how a leading power distribution utility used Applied AI to unify two separate meter data systems covering 700,000 smart meters, move transformer maintenance from reactive to proactive, and give every team one place to query its data, with 11 faults confirmed across 12 field inspections.


