A September 2025 study of 72 Indian DISCOMs found that only 36 published outage data on their websites. Of those, just 17 reported SAIDI and SAIFI, with differences in how the indices were calculated.
The System Average Interruption Duration Index (SAIDI) measures how long consumers experience power interruptions on average, while the System Average Interruption Frequency Index (SAIFI) measures how frequently interruptions occur. DISCOMs use both to assess supply reliability.
Some state regulators have also established time-bound reliability targets and periodic compliance reporting requirements, making accurate outage data increasingly important.
However, missing outage records, incorrect restoration timestamps and inaccurate counts of affected consumers can distort these indices and affect how DISCOMs assess network performance.
Automated data checks and AI can help DISCOMs identify and investigate discrepancies in outage records, allowing utility teams to verify the data before calculating these indices.
How Are SAIDI and SAIFI Calculated?
SAIDI and SAIFI use the total number of consumers served during a reporting period, but their calculations differ based on interruption duration and frequency.
1. SAIDI Formula
SAIDI = Total consumer-interruption minutes ÷ Total consumers served
For each qualifying outage, calculate the interruption minutes experienced by the affected consumer, accounting for different restoration times where applicable. Add these to obtain total consumer-interruption minutes.
2. SAIFI Formula
SAIFI = Total consumer interruptions ÷ Total consumers served
Count the consumers affected by each qualifying interruption. A consumer experiencing multiple interruptions is counted each time.
Example: Calculating SAIDI and SAIFI
Consider a DISCOM serving 1,000 consumers. During the reporting period, a single power outage affects 200 consumers, interrupting their electricity supply for 90 minutes (1 hour and 30 minutes).
SAIDI Calculation: SAIDI = (200 consumers × 90 minutes) ÷ 1,000 consumers
SAIDI = 18 minutes per consumer
SAIFI Calculation: SAIFI = 200 consumer interruptions ÷ 1,000 consumers
SAIFI = 0.2 interruptions per consumer
These are system-wide averages. The 200 affected consumers experienced one 90-minute outage, while the remaining 800 experienced no interruption. These calculations illustrate consumer-based reliability indices. Some Indian reporting requirements also use load-based calculations at feeder level. DISCOMs must follow the calculation methodology and qualifying interruption rules prescribed by their applicable regulator.
What Outage Data Affects SAIDI and SAIFI Accuracy?
Accurate SAIDI and SAIFI reporting depends on knowing when electricity supply was interrupted, when it was restored and how many consumers were affected. DISCOMs also need to account for interruptions that qualify under the applicable reporting rules.
This information comes from different systems, including Outage Management Systems (OMS), Supervisory Control and Data Acquisition (SCADA), Advanced Metering Infrastructure (AMI) and consumer-to-network mapping records. Errors in these records can affect the reported indices.
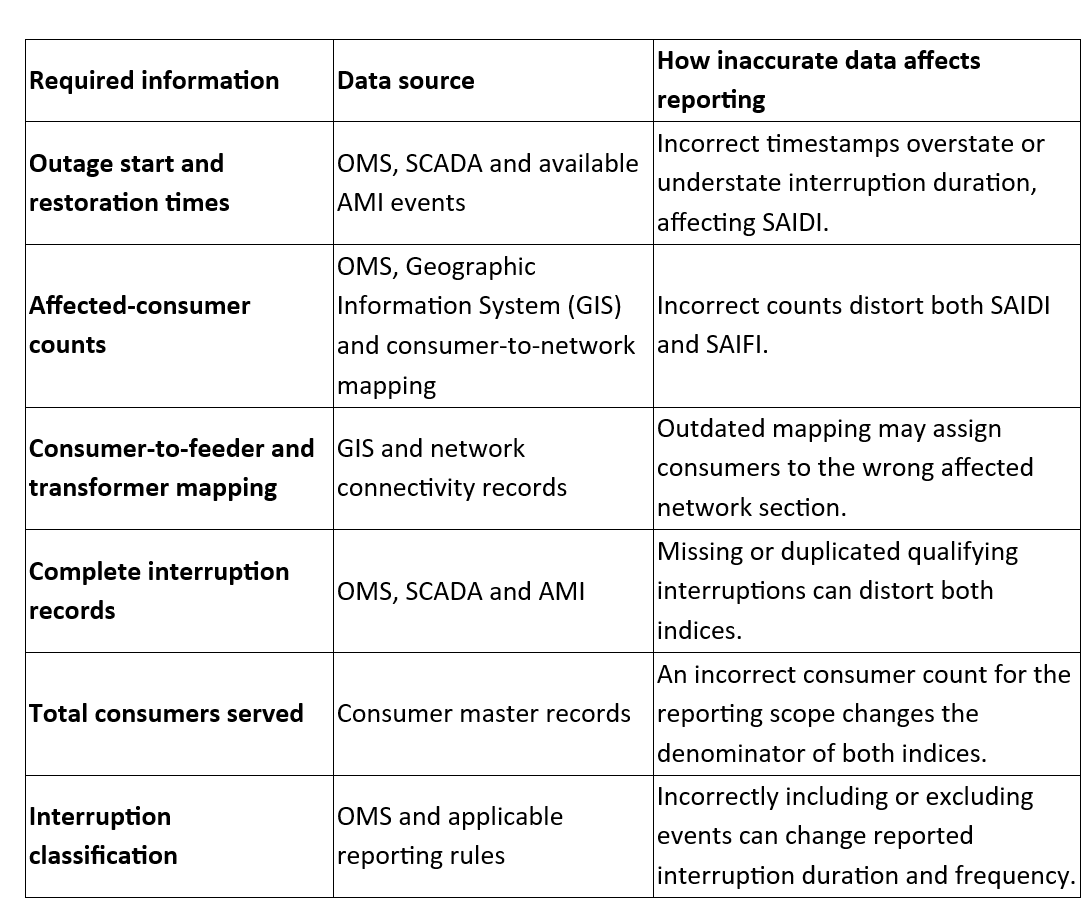
DISCOMs must also follow the reporting basis and calculation methodology prescribed by their State Electricity Regulatory Commission (SERC). The Central Electricity Authority (CEA) provides reporting formats covering consumer interruptions and load-based interruptions.
Why Restoration Records Need Closer Attention
Consider a feeder outage affecting 400 consumers. Supply returns to 250 consumers after 20 minutes, while the remaining 150 wait 90 minutes.
If the outage record assigns a 90-minute interruption to all 400 consumers, the calculation would be:
- Incorrect record: 400 × 90 = 36,000 consumer interruption minutes.
- Actual consumer-interruption minutes: (250 × 20) + (150 × 90) = 18,500.
The incorrect record overstates consumer-interruption minutes by 17,500, nearly doubling this outage's contribution to SAIDI.
Outdated consumer-to-network mapping can also affect which consumers are attributed to an interruption. If consumers are assigned to the wrong distribution transformers or feeders, the affected-consumer count may be incorrect.
In a WorkOnGrid Applied AI implementation, a utility used consumer and transformer outage timestamps to help identify correct network connections, improving consumer-to-DT mapping accuracy from 58% to 95%.
How Can Analytics and AI Help DISCOMs Validate SAIDI and SAIFI Data?
DISCOMs can use automated validation rules to flag missing restoration timestamps, duplicate incident records and interruptions that do not meet reporting criteria. These checks identify known data errors without requiring AI.
More complex investigations arise when records from different systems disagree.
Consider an Outage Management System (OMS) recording a feeder's restoration at 3:00 PM. SCADA logs show a switching operation at 2:30 PM, while available smart meter events indicate power restoration around 2:40 PM.
Conventional analytics can flag the difference between the OMS restoration time and smart meter events, while the SCADA switching operation provides additional context for the investigation.
How Applied AI Supports the Investigation
With Applied AI's Conversational Intelligence, analysts can query approved operational worksheets and reports in natural language, examine flagged discrepancies and ask follow-up questions without manually preparing a separate report for each investigation.
For example, an analyst could ask:
"For the outages with conflicting restoration times, show the recorded event timelines, supporting evidence and information still needed to investigate each discrepancy."
Using the relevant records, Applied AI can support an investigation that brings together:
- Affected incidents: Outage and feeder identifiers requiring investigation.
- Conflicting records: Differences between recorded restoration times and available operational events.
- Unresolved questions: Missing evidence or inconsistencies requiring further checks.
These are illustrative investigation outputs, rather than a predefined SAIDI and SAIFI validation report.
For recurring reviews, WorkOnGrid's Analysis Agents can also be configured to analyse selected data and generate structured reports.
The reporting team then reviews the supporting evidence and approves any corrections before finalising the reliability figures.
How Should DISCOM Leaders Use Verified SAIDI and SAIFI Reports?
SAIDI and SAIFI reports help DISCOM leaders identify poorly performing feeders, prioritise network improvements and assess performance against regulatory targets. However, system-wide averages can hide areas where consumers experience frequent or prolonged interruptions.
Consider two feeders with the following annual reliability figures:

Both feeders have the same average interruption duration per consumer over the year. However, Feeder A averages 120 minutes per consumer interruption, compared with 30 minutes for Feeder B.
For Feeder A, the operations team should examine prolonged restoration times. For Feeder B, the priority is investigating repeated interruptions and identifying the affected network sections.
Better outage data can also change reported reliability trends
As DISCOMs improve outage monitoring and capture interruptions that were previously missed, reported SAIDI or SAIFI may increase even if actual supply reliability has not deteriorated. Leaders should distinguish changes in data coverage from changes in network performance when comparing reporting periods.
Regulatory targets make these comparisons more important
In May 2026, the Andhra Pradesh Electricity Regulatory Commission (APERC) set 5-year SAIDI and SAIFI targets for non-industrial 33 kV and 11 kV feeders serving cities and towns with populations above one lakh. For Southern Power Distribution Company of Andhra Pradesh Limited (APSPDCL), SAIDI must decrease from 25 hours and 15 minutes in FY 2026–27 to 24 hours and 30 minutes by FY 2030–31, while SAIFI must fall from 49 to 33. The DISCOMs must also submit quarterly compliance reports.
Also Read: Enhancing Reliability and Reducing Outages with SMOC : Grid
How WorkOnGrid Supports SAIDI and SAIFI Reporting
WorkOnGrid's SMOC supports outage monitoring and can be configured to track reliability indicators such as SAIDI and SAIFI through dashboards and reports. With data from connected utility systems, DISCOMs can review reliability performance across feeders and reporting periods.
For deeper analysis, WorkOnGrid Applied AI allows analysts to query selected operational reports and worksheets in natural language. Teams can examine specific findings using the available outage and network data.
Talk to our team to discuss how WorkOnGrid can support your utility's reliability monitoring and reporting.