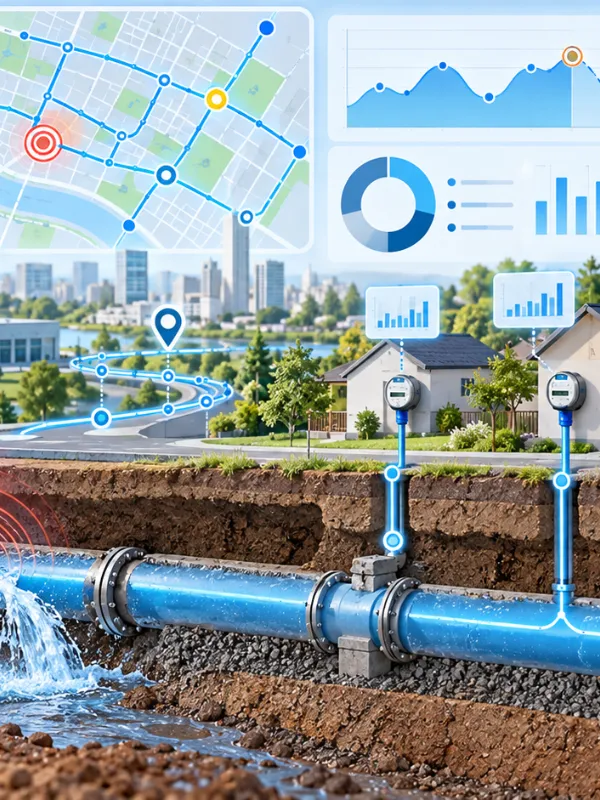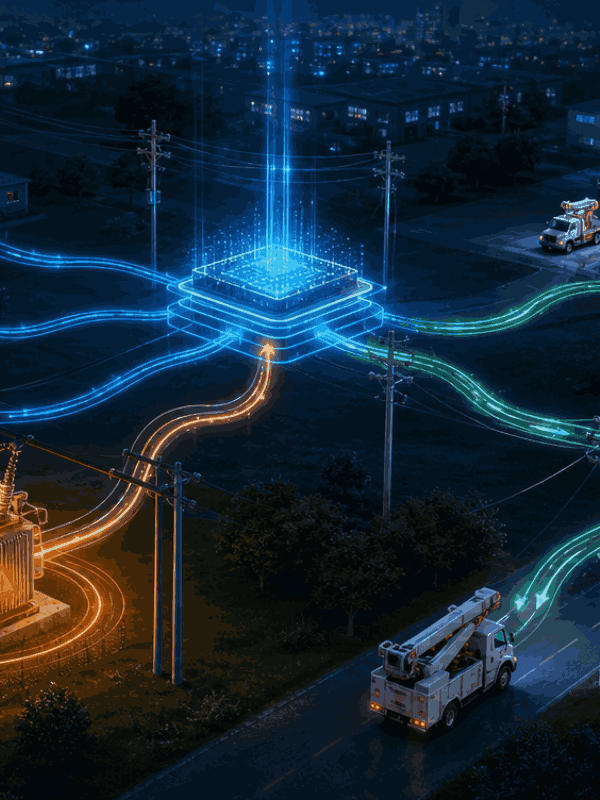
A DISCOM can see that a transformer was repeatedly overloaded, a feeder recorded higher losses, or a group of meters stopped communicating. For the operations team, the next questions are more specific: Is the condition isolated or recurring? Is it getting worse? How many consumers or assets are affected? Does it need immediate investigation, or can it be monitored?
Answering those questions consistently becomes difficult when the same assessment has to be made across thousands of meters, assets and network events. The International Energy Agency found that 70% of surveyed network operators widely use AI for maintenance, while only 23% use it in real-time operations. The harder problem is using analytics and AI to support these kinds of day-to-day operational decisions across the network.
The value of analytics therefore depends on more than producing another alert, score or forecast. It depends on whether the analysis brings together the right operational context and gives teams enough information to decide what the issue requires next.
Where Should a DISCOM Use Analytics First?
A good analytics use case usually starts with an operational decision that is difficult to make consistently at scale.
A meter operations team, for example, may need to review thousands of communication exceptions. A loss-reduction team has to decide which feeders or transformer areas require deeper investigation. An asset team have to determine which transformers deserve inspection before others. In each case, the challenge is using the available information to decide which issues need attention first.
Before applying analytics, a DISCOM can ask a few practical questions:
- Does this decision have to be made frequently or across a large number of cases?
- Does it depend on several operational factors rather than one clear condition?
- Does manual review take significant time or rely heavily on individual judgement?
- Would identifying the issue earlier or more consistently change what the team does?
- Can the result lead to a clear action such as monitoring, investigation, maintenance or field work?
If the answer to these questions is yes, analytics has a clear operational role. The next step is to work backwards from the decision itself.
What Data Does a DISCOM Need for an Analytics Use Case?
With the decision identified, the data should follow the operational question. The goal is not to pull every available dataset into the analysis.
Take transformer health. Loading data may show that a transformer is under stress, but it may not tell the team whether intervention is required. That judgement depends on the transformer’s rating, the demand connected to it, and how the asset has behaved over time.
The information required changes with the problem:
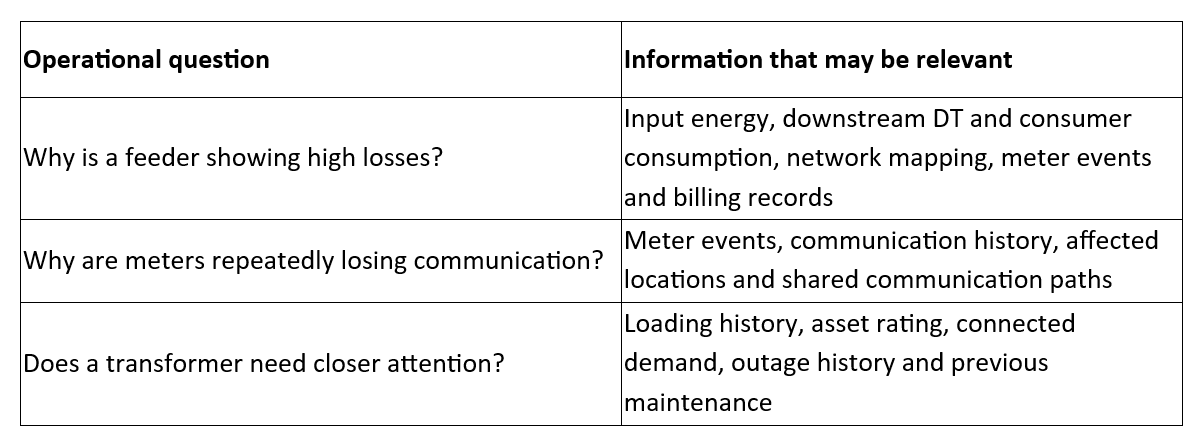
The point is not that every use case needs all of these sources. Each additional input should help answer a specific part of the decision. For a DISCOM, the practical question is therefore not “How much data can we bring together?” but “Which information would materially change this decision?”
Also Read: Smart Energy Meter Guide for Utilities 2025: ROI & Use Cases : Grid
Is the Resulting Analytics Signal Strong Enough to Act On?
Analytics can flag an unusual condition without confirming the underlying problem. Electricity theft is a clear example. A sudden drop in consumption may make a consumer worth reviewing, yet it is not proof of theft. A tamper event recorded by a meter is also a useful signal, although not every logged event will lead to a confirmed theft case.
Smart Utilities makes this distinction in its analysis of meter data: consumption patterns can provide an initial lead, while additional meter parameters and event information help utilities filter cases before investigation. The objective is to improve the quality of cases sent for further action instead of treating every abnormal reading as a confirmed problem.
The same applies beyond theft detection. An abnormal meter reading, transformer risk score or communication anomaly may warrant attention, but the operations team still needs to know how reliable the finding is and what evidence supports it. Otherwise, teams can spend time reviewing false positives or investigating cases that do not require intervention.
Stronger evidence makes it easier to decide whether a case should be monitored, investigated further or sent for action.
How Does a DISCOM Keep Analytics Useful as the Network Changes?
An analytics use case does not remain accurate simply because it worked when it was first built. The network and the records behind it continue to change.
Consumers may be shifted between transformers, meters may be replaced, assets may be upgraded, network configurations may change, and new consumption patterns may emerge. If those changes are not reflected in the data used for analysis, the result can gradually become less reliable.
Consumer-to-transformer mapping is a simple example. A loss analysis at DT level depends on knowing which consumers are actually supplied by that transformer. If the physical connection changes but the recorded mapping does not, consumption can be attributed to the wrong DT and the resulting loss assessment can point the team in the wrong direction.
The same principle applies to analytical models. Patterns that were useful for identifying an abnormal condition should be checked against newer operating data and the outcome of investigations in the field. If an issue flagged as high risk repeatedly turns out to be normal, or a condition that was being missed starts appearing more often, the rules or model may need to be reviewed.
Keeping analytics useful, therefore, requires an ongoing loop between the operational data, the analytical result, and what teams actually find when they investigate the issue. The analysis should change when the network it represents changes.
Also Read: AMI Transformer Analytics: From Risk Detection to the Right Response: Grid
Where Does AI Add Value Beyond Conventional Analytics?
Most utility analytics start with a defined question. A dashboard may track feeder losses, a model may score transformer risk, or a report may identify meters that repeatedly miss communication SLAs. The utility decides what it wants to measure, and the analysis is built around that question.
But operators often need to ask additional questions once an abnormal condition is identified. They may want to know what changed before it appeared, whether similar cases exist elsewhere, or what other operational events occurred around the same time. Each follow-up can require another query, filter or analysis.
This is one area where AI can extend analytics. Instead of requiring every question to be built into a dashboard beforehand, users can query governed operational data in natural language and continue the investigation with follow-up questions.
For example, rather than stopping at a list of transformers with high-risk scores, an operator could ask which of those assets have also experienced repeated outages, worsening loading patterns or recent field interventions.
How WorkOnGrid Connects Analytics to Action
WorkOnGrid connects the steps into one operational flow. Utilities can bring together the data required for an analysis through the Integration Layer and Data Hub, use Reporting, and Business Intelligence to identify patterns and risks, and use Applied AI and Conversational Intelligence to investigate those findings further.
Take a feeder showing high losses. Relevant energy, consumption and network-mapping data can be analysed together to help narrow where the loss requires further investigation. Once a finding needs follow-up, Workflows and Automation can route it into the appropriate operational process, while Field Service Management can support cases that require investigation on the ground.
This creates a connected path from operational data and analysis to the team responsible for taking the next action.
Talk to our team to see how WorkOnGrid can support analytics-led utility operations.