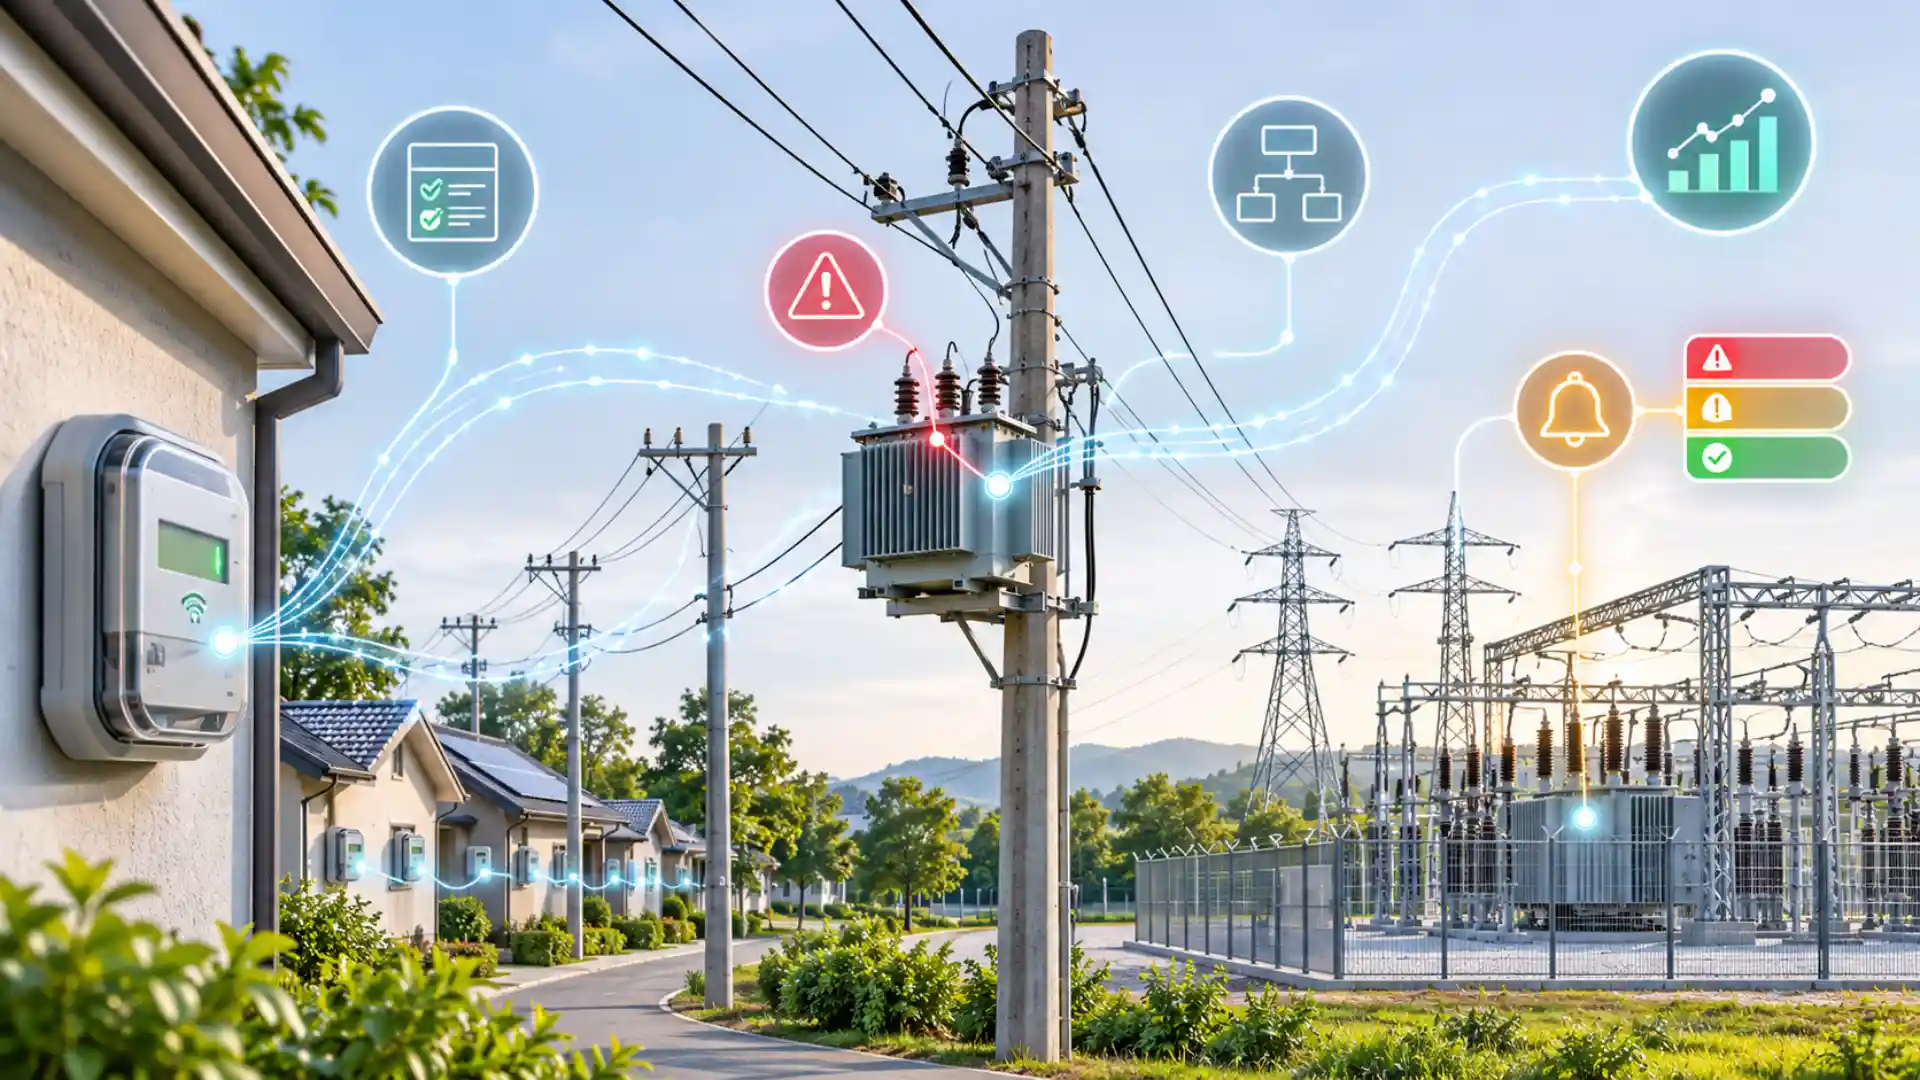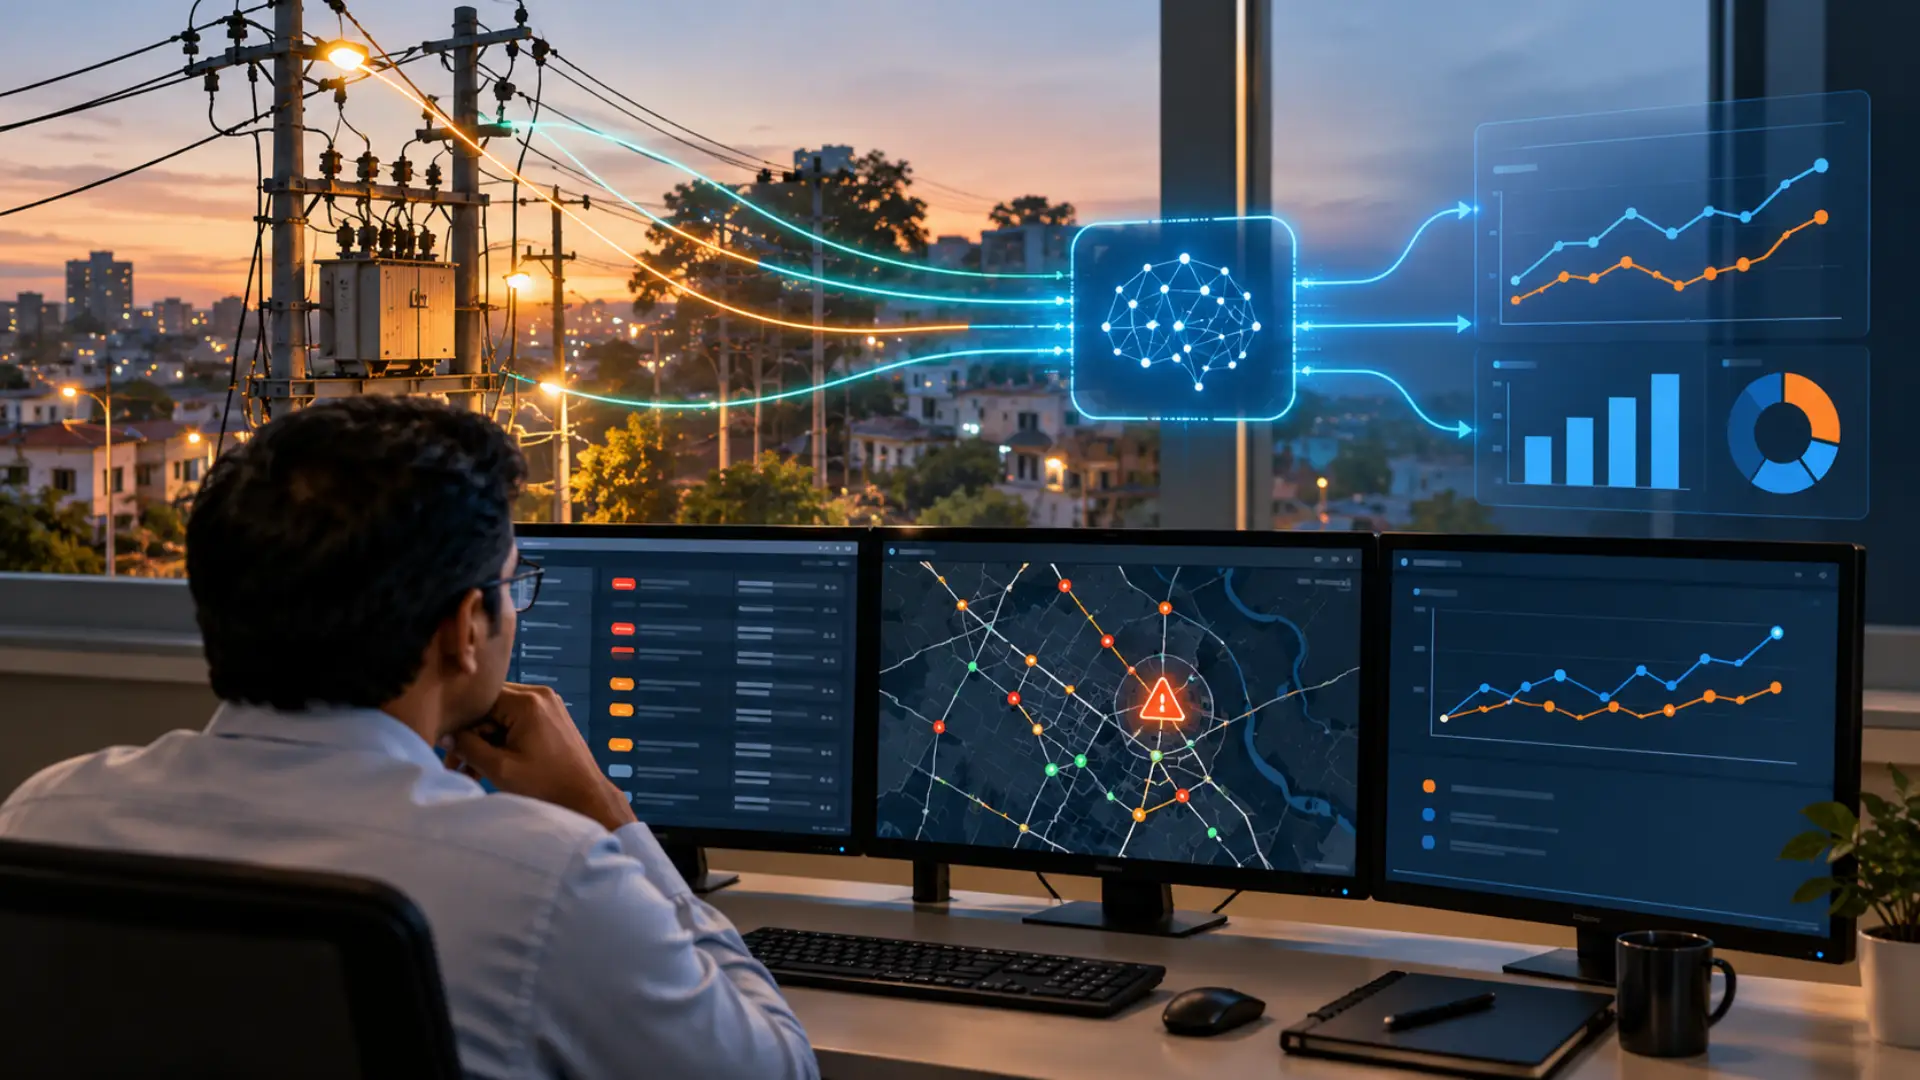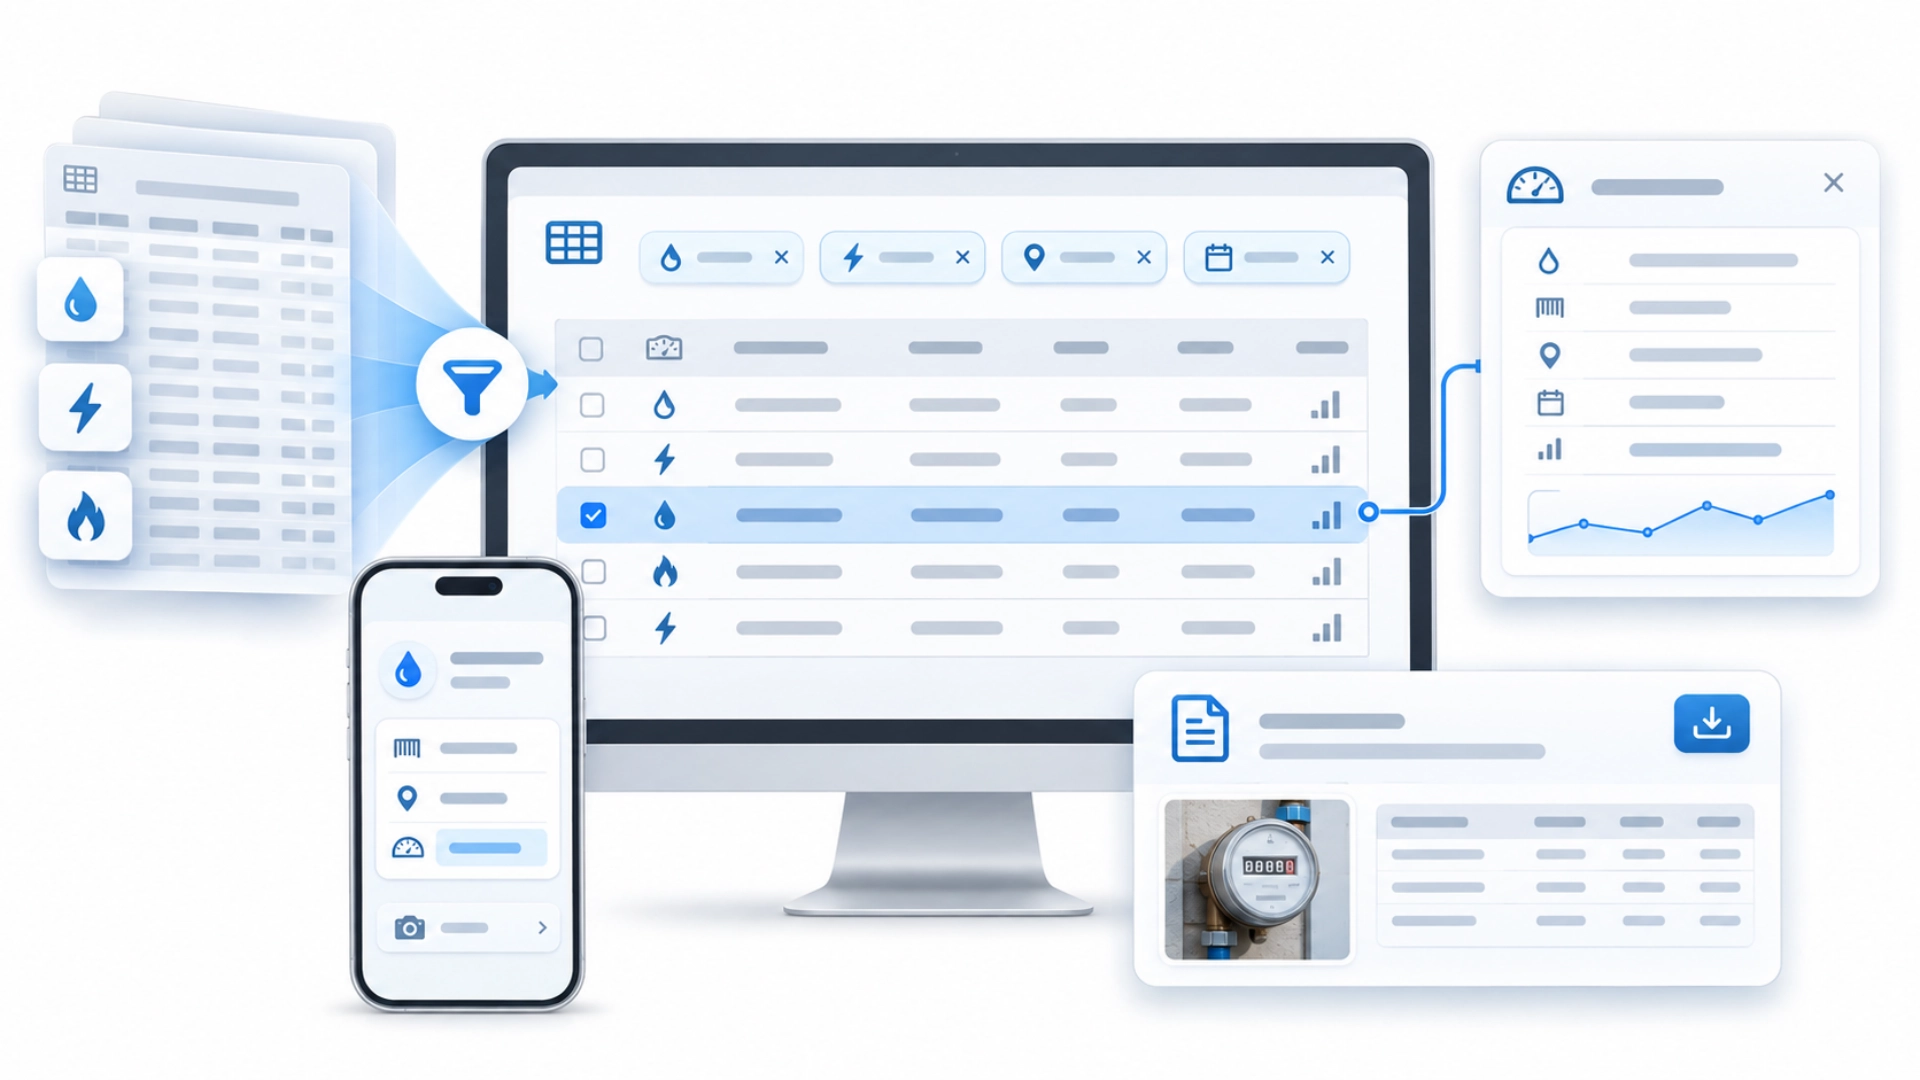
A DISCOM operator investigating meter communication failures may have millions of records available but only needs to know which meters reported a particular event, in which area, and during what period.
This is where filtering helps. A filter narrows the records displayed based on selected conditions, such as a consumer number, date range or event severity. Once the relevant records are available, operators also need to review them clearly, access important details on mobile devices and share reports with supporting information.
In our earlier feature blogs, we showed how WorkOnGrid's AI can investigate transformer health, run recurring analyses through Analysis Agents and work with a preferred LLM provider. Here we will look at how WorkOnGrid helps operators filter, find and review specific utility records, using a meter event investigation as an example.
Mandatory Global Filters: Load Only the Data You Need
Loading all the meter records at once can slow down access to operational data. Mandatory Global Filters address this by requiring users to narrow the data before it loads.
Administrators can enable the “Make Filter Pre-load to View Data” option. Once enabled, the operator must select at least one of the configured filters before the data loads.
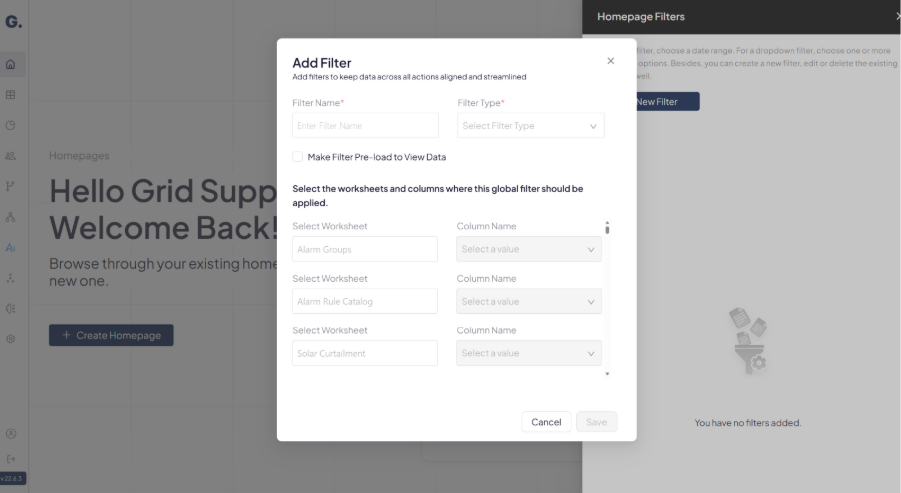
For example, an operator can search for meter records using either a consumer number or meter serial number, depending on the filters configured. Only the records matching the selected filter are then loaded.
Related filters also work together when they use the same data source. If the operator selects a consumer number first, the meter number filter displays only the meters linked to that consumer. This prevents incorrect filter combinations and helps ensure accurate report and dashboard results.
Row-Level Linkage: Investigate Specific Combinations of Events
Suppose an operator is investigating critical meter communication failures. The events and alarms worksheet contains different event types, severity levels, meter IDs and timestamps. They need to identify the meters associated with critical communication failures.
With Row-Level Linkage, the operator can select a row in a summary table showing Critical under Severity and Communication Failure under Event Type. The system then retrieves records matching both values.
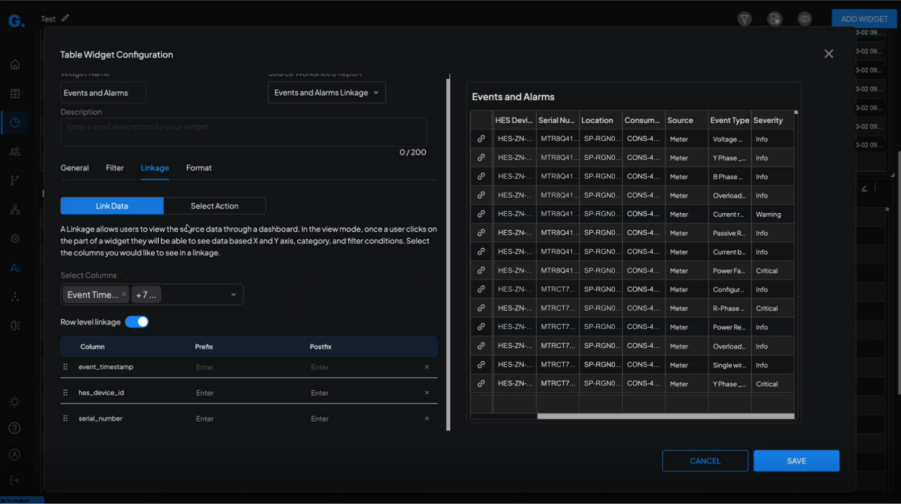
The linked view can also display additional details from the source worksheet, such as meter ID, consumer number, timestamp and HES ID, even if these columns were not shown in the original table.
This helps the operator identify which meters reported the selected event and examine the corresponding records without manually filtering each column separately.
Applied Filters Panel: Adjust Filters During an Investigation
The Applied Filters panel shows the filters currently selected on a dashboard. Operators can now change or remove filter values directly from this panel without reopening the main Filters menu.
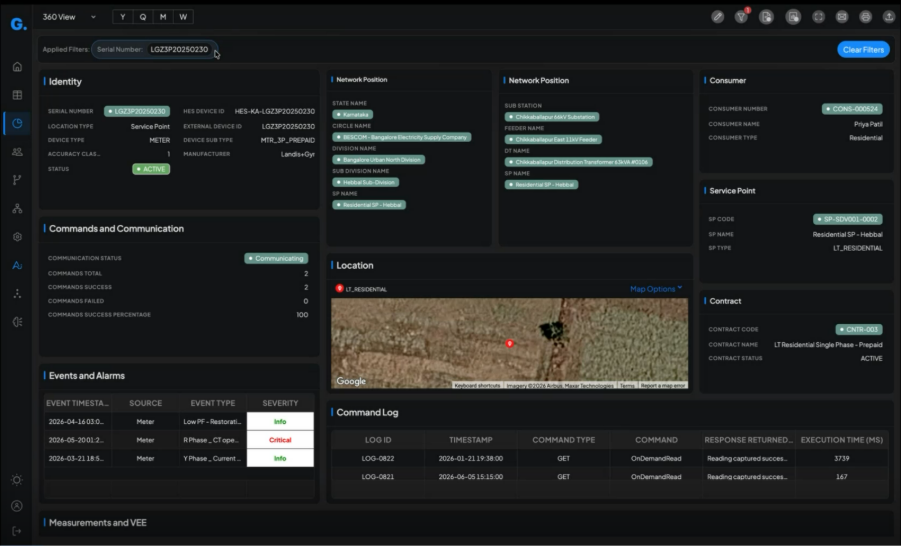
For example, an operator reviewing a meter's consumer information and network location may need to check another meter. Instead of reopening the Filters menu, they can select the existing Serial Number filter from the Applied Filters panel and change its value.
Operators can also deselect or remove existing filter values. To add another filter, they can use the Open Filters icon and subsequently adjust or remove its value directly from the dashboard. This makes it easier to move between meter records and refine an investigation directly from the dashboard.
Widget Header Formatting: Make Operational Data Easier to Read
After filtering meter events and alarms, an operator may have several tables and charts showing different information. For example, one table may list critical meter alarms, while another chart shows the number of alarms by event type. When these appear together, each view needs a clear heading so supervisors can quickly understand what they are looking at.
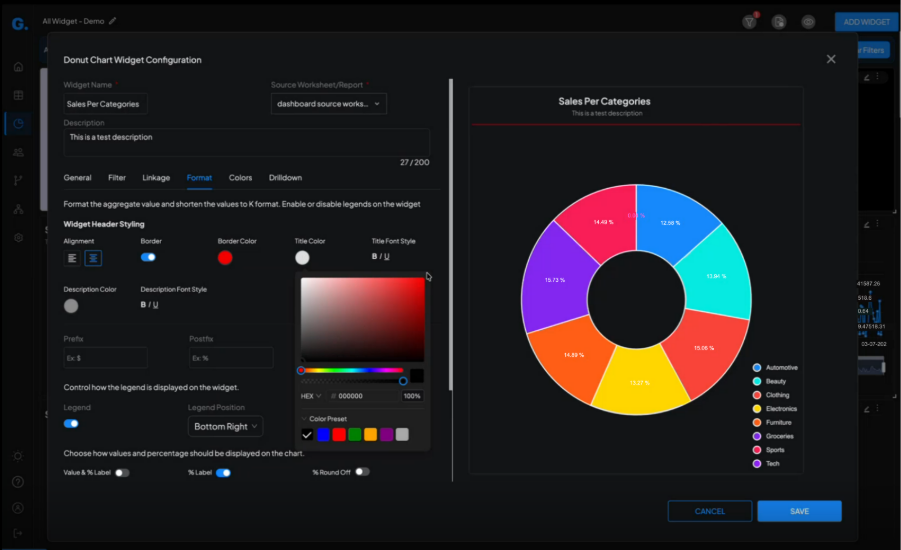
With Widget Header Formatting, users can customise the title and description styles, text colours, borders and text alignment (left or centre) for each supported widget.
For example, the operator can give the critical alarms table a distinct header style and use a different border or title colour for the event summary chart. This makes the two views easier to distinguish when reviewing the information.
Note: Header formatting is supported for all applicable widget types except Text and Number widgets.
Spotlight Columns: Show Field Teams the Most Relevant Information
Field technicians often need to review several details when opening an assigned task on their mobile phones. Scrolling through multiple columns to find the required information can slow down their work.
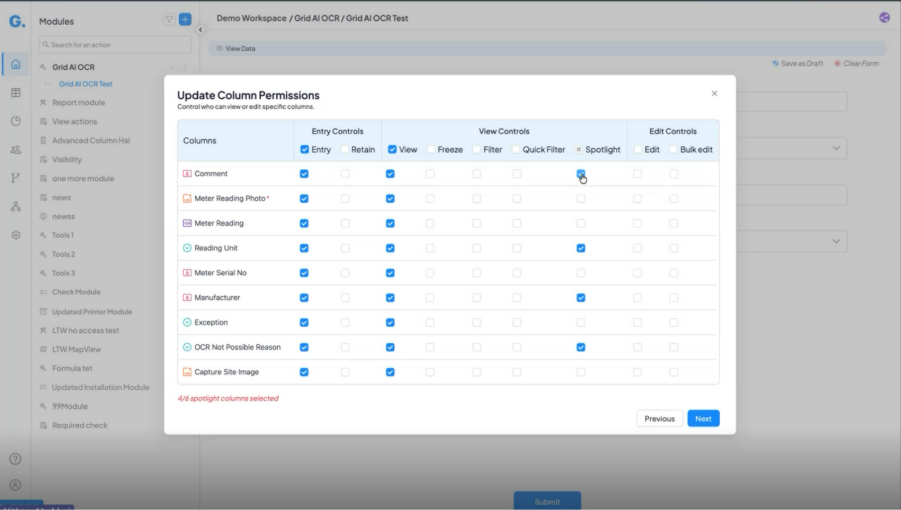
With Spotlight Columns, administrators can select up to six columns while configuring an action. These columns appear prominently in the mobile preview, allowing field teams to see the most relevant information first.
For example, a technician investigating a meter communication failure may need the meter serial number, consumer number, location, event type, severity and timestamp. These fields can be selected as spotlight columns so the technician can review them without expanding the record and searching through other columns.
OLAP Image Export: Download Images Alongside Report Data
A DISCOM team reviewing field inspection records may need both the report data and the photographs associated with those records. Previously, exporting an OLAP report provided references to the media without downloading the actual files.
With OLAP Image Export, users can now download images from media columns alongside their report data. They can select the file name, media column and column tag, which helps associate the downloaded images with the relevant records.
For example, when reviewing meter inspection records that contain photographs, the team can download the report and its associated images for further review or sharing with supervisors. This makes it easier to access supporting visual evidence alongside operational records without retrieving each image separately.
Making Everyday Utility Operations More Efficient
For DISCOM operators, finding the right records, investigating issues and sharing information are part of everyday work. The easier these tasks become, the more time teams can spend addressing operational issues.
WorkOnGrid's latest features simplify these activities by helping operators narrow large datasets, investigate specific records, adjust filters, present information clearly and access relevant details in the field. Talk to our team to see how we can help your utility teams work more efficiently with operational data.