

India’s Aggregate Technical and Commercial (AT&C) losses stood at 15.04% in FY25, according to the Ministry of Power. Of that, roughly 12.4 percentage points sit in the gap between energy supplied and energy billed, while about 2.6 points sit between billing and collection.
But the percentage does not explain what is driving the loss. Energy may be lost through the distribution network, go unaccounted for because of metering or mapping gaps, be consumed but not billed correctly, or be billed but not collected. These are different problems, with different owners and responses.
Until a DISCOM breaks the AT&C number down, it cannot tell where the loss is occurring, what is causing it and where to focus first.
How should a DISCOM read an AT&C loss number?
An AT&C loss percentage is the result of 2 things: how much of the energy entering the distribution system is billed, and how much of that billed amount is collected.
At its simplest: Energy input → Energy billed → Revenue collected
This gives a DISCOM two numbers to look at alongside AT&C loss:
- Billing efficiency shows how much of the input energy was converted into billed energy. A gap here means energy has been lost or has not been fully accounted for before billing.
- Collection efficiency shows how much of the amount billed was actually collected. A gap here means the energy has already been billed, but the full billed amount has not been collected.
AT&C loss combines both into one percentage. That makes it useful for tracking overall performance, but not sufficient for diagnosing the problem. A reduction in AT&C loss could come from better billing efficiency, better collections or improvements in both. Likewise, two DISCOMs with the same AT&C loss can have very different underlying problems.
If billing efficiency is low, where can the missing energy be going?
Low billing efficiency means that part of the energy entering the distribution system is not showing up as billed energy. But that gap can form for very different reasons.
- Some energy is physically lost in the network: Electricity is lost as it moves through feeders, transformers and LT lines. The level of technical loss can increase with conditions such as overloaded equipment, long network sections, poor network configuration or load imbalance. This energy never reaches the point where it can be billed. For example, a feeder-level study by the Council on Energy, Environment and Water (CEEW) in Uttar Pradesh found that technical factors accounted for about one-third of distribution losses on the feeder studied.
- Some energy reaches consumers but is not properly accounted for: Missing or damaged meters, incorrect consumer indexing, unmetered consumption and gaps in meter readings can create a mismatch between the energy supplied and what the DISCOM can account for against consumers. In the same CEEW study, 8% of consumers were incorrectly tagged, 14% had no meter or a burnt or damaged meter, and nearly half of bills were generated without an actual meter reading.
- Some consumed energy is under-billed or not billed at all: Theft, meter bypass or tampering, under-recorded consumption and under-billing can all widen the gap between energy supplied and energy billed. CEEW found that commercial losses including metering gaps, under-billing and theft, all accounted for about two-thirds of the losses on the feeder it studied.
This is why a low billing-efficiency figure does not point to one problem. The same gap can contain physical network loss, gaps in energy accounting and revenue leakage from consumption that is not correctly billed.
Also Read: Using AI and AMI Data for Revenue Assurance : Grid
Where in the network is the loss concentrated?
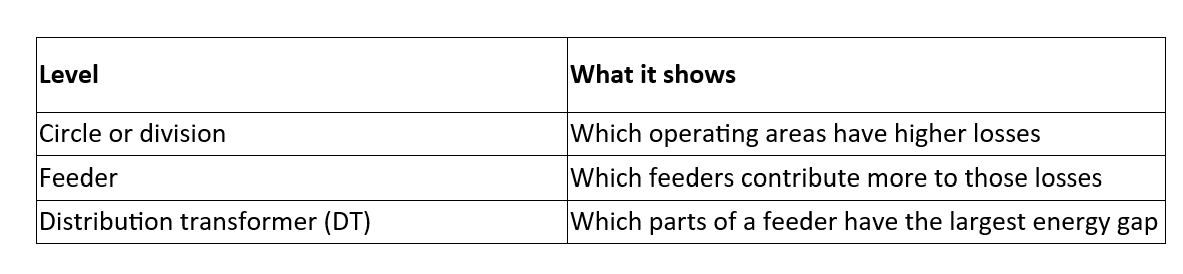
A loss figure at the DISCOM, circle or division level can identify a poorly performing area. To narrow the problem further, the energy balance has to be measured lower down the network.
Each level narrows the loss further:
This becomes difficult when metering is incomplete. An analysis by Prayas (Energy Group) of Central Electricity Authority data found that only 42% of distribution transformers were metered as of March 2024, falling to 32% for rural DTs.
Where DT-level analysis is available, the consumer mapping behind it also needs to be accurate. If consumers are assigned to the wrong DT, the downstream consumption will be compared against the wrong transformer input, distorting the loss calculation.
Without reliable DT metering and accurate network mapping, a DISCOM may identify a high-loss feeder but still struggle to determine where within that feeder the loss is concentrated.
Collection loss starts after the bill is raised
Once energy has been billed, the remaining AT&C gap comes from revenue that has not been collected.
The collection-efficiency percentage shows how much of the billed amount was recovered, but it does not show where the unpaid amount is concentrated. A DISCOM may still have significant outstanding dues concentrated among specific consumer groups, locations or high-value accounts.
To understand the collection gap, the DISCOM needs to identify:
- which consumers account for the largest unpaid amount
- where arrears are building up
- which accounts repeatedly delay or miss payments
- whether outstanding dues are concentrated in particular consumer categories or geographies
This helps the DISCOM focus collection efforts on the accounts and areas contributing most to the revenue gap, instead of treating every consumer the same.
From identifying AT&C losses to acting on them
For a DISCOM to act on AT&C losses, the loss needs to be connected back to the network, consumers and operational data behind it.
Grid Intelligence helps build that network context. At the DT level, for example, consumer-to-DT mapping helps ensure that downstream consumption is compared against the transformer actually supplying those consumers. Incorrect mapping can distort the energy balance and make a genuine loss pocket harder to identify.
The same principle applies more broadly to loss analysis. A leading European utility managing more than 1.3 million smart meters and around 120 GB of data each day needed better reporting, energy audits and loss accounting. WorkOnGrid built a data and analytics layer that supported transformer-level loss monitoring, data-quality reporting and the identification of theft and fraud patterns, while improving the reliability of incoming data used for billing.
The result is better visibility into where losses are occurring and which areas or records need further investigation, rather than relying on the aggregate AT&C percentage alone.
Want to understand where your AT&C losses are really coming from? Talk to our experts about improving network visibility and making loss analysis more reliable.


.png)


