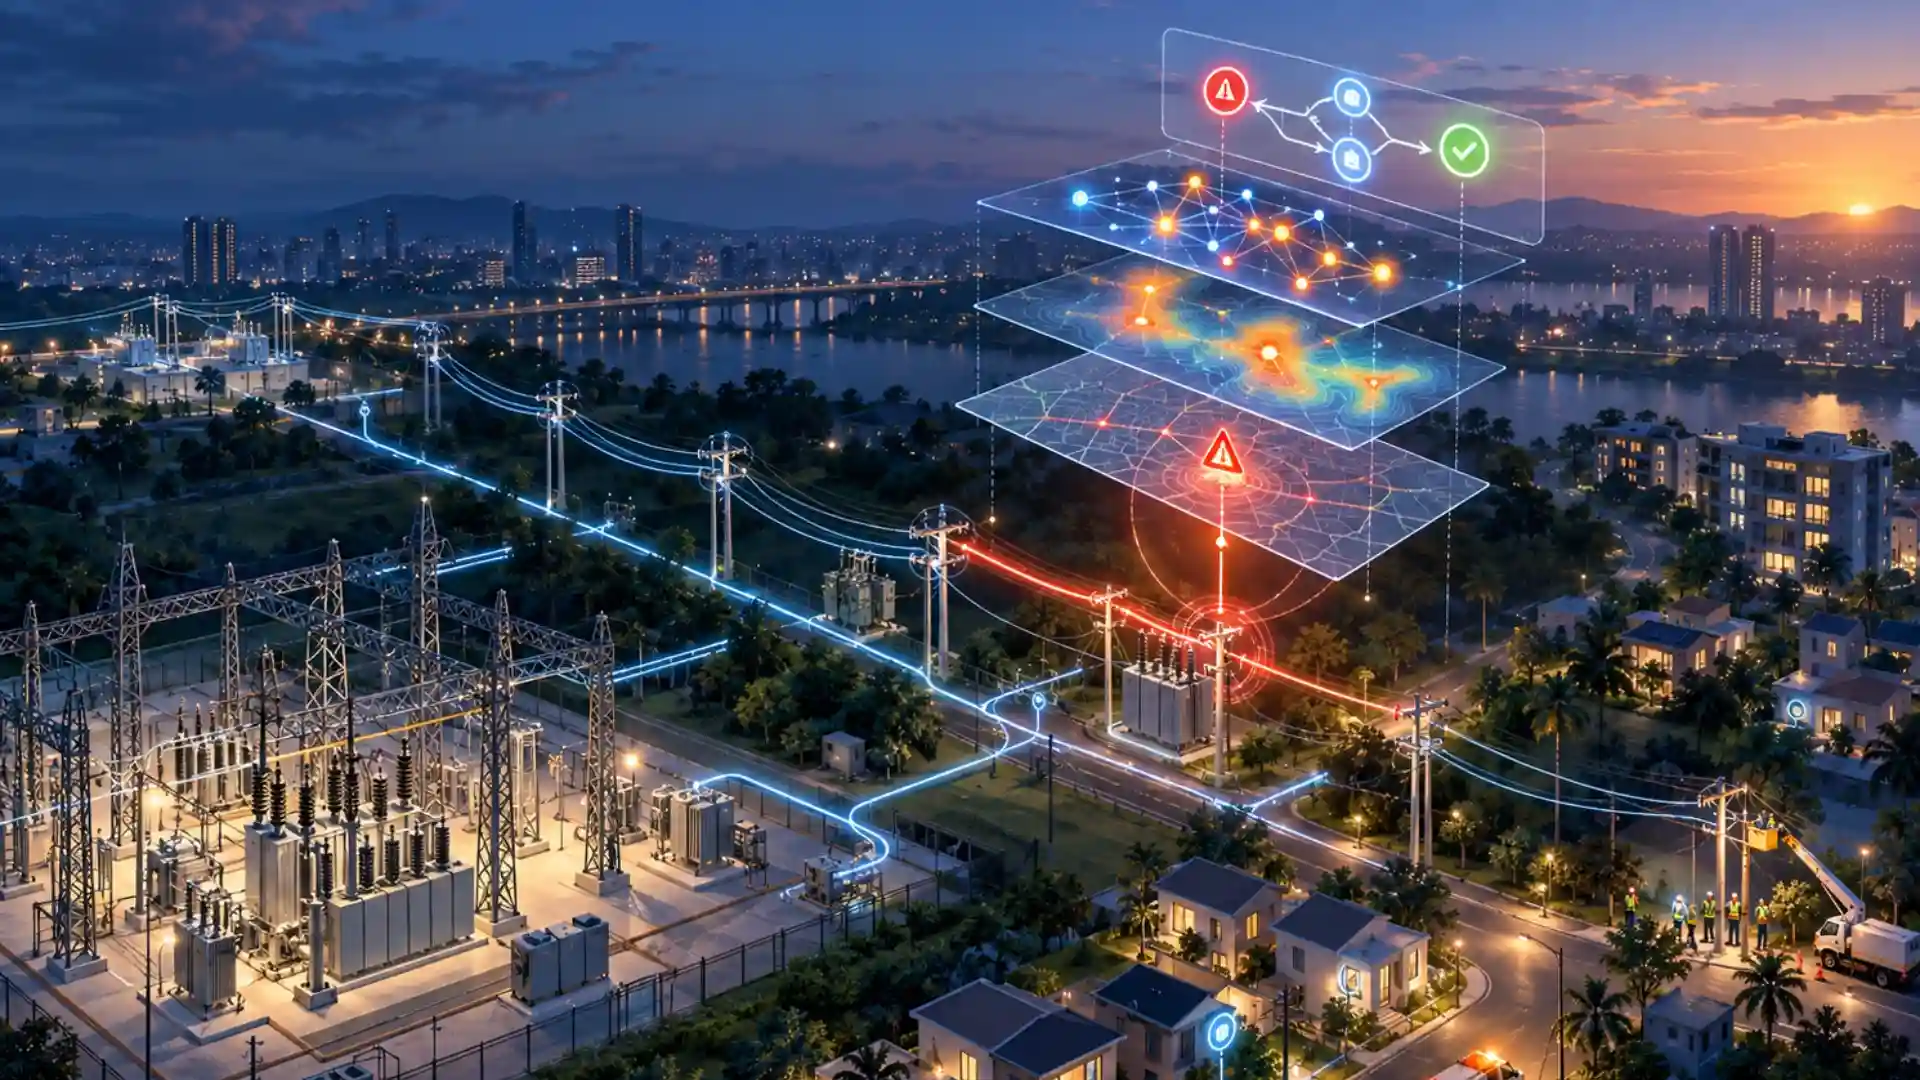
Most utilities now run on data that lives in many places at once. Load readings sit in SCADA (Supervisory Control and Data Acquisition), consumption data sits in AMI (Advanced Metering Infrastructure) and the MDM (Meter Data Management system), network topology sits in GIS (Geographic Information System), faults sit in the OMS (Outage Management System), and the rest is spread across billing, asset registers and workforce systems.
Each system does its job. The problem begins when a DISCOM has to answer one operational question that cuts across all of them.
When a feeder trips, a transformer overloads, a meter stops communicating, or a theft pattern appears, the answer rarely sits in one place. The operations team has to connect signals from several systems before it can decide what is actually happening.
That is why IT/OT convergence matters.
It brings (OT) operational technology and (IT) information technology onto common ground, so grid, meter, asset, consumer and field data can be read together. It helps utilities move from scattered information to a shared operational view.
But there is a second half to this story. Connecting the data answers one question: where is the information?
It does not answer the harder question an operator faces every shift: of everything now visible, what needs attention first, and what should happen next?
What IT/OT convergence delivers for a DISCOM
For a DISCOM, IT/OT convergence matters when it improves the operating numbers that teams are already accountable for: loss reduction, billing accuracy, restoration time, asset performance and regulatory reporting.
The smart-meter rollout is adding more operational data to the utility every quarter. That data only pays back when the utility can read it together, instead of treating every system as a separate record room.
IT/OT convergence helps create that connected view. So, this can mean:
- Feeder-to-consumer visibility: Feeder and distribution-transformer load can be matched with meter and consumer records, so energy accounting is possible at every stage, not just at the meters.
- Faster outage response: OMS events, GIS assets and AMI last-gasp signals can be read together to locate faults and identify affected consumers faster.
- Tighter loss and revenue control: Metering, network and billing data can be compared to surface theft, unbilled supply, abnormal consumption and meter gaps.
- Earlier asset intervention: Distribution-transformer loading, event history and consumption patterns can reveal stress before failure.
- Cleaner regulatory reporting: Teams can work from reconciled operational and commercial data instead of stitching spreadsheets before every submission.
These are real gains. But they still depend on interpretation.
A unified view reduces the time spent searching for information. It does not automatically remove the time spent deciding what that information means.
That is where many convergence programmes stop short. They bring the signals together, but the operator still has to work out which signal matters, how urgent it is and what action should follow.
What turns a unified view into a decision
A unified view becomes useful when it helps the operator make the next call.
Consider an evening peak. A distribution transformer is nearing overload. Meter events are rising on the connected feeder. OMS shows a recent fault in the same area. A few consumers have logged complaints. One field crew is available.
A converged dashboard can show all of this together. But the engineer still has to decide whether this is an asset risk, a network fault, a meter communication issue, a theft pattern, or several unrelated events appearing at the same time.
That is where operational time goes. The problem is not lack of visibility. The problem is the work that still sits between visibility and action.
An operational intelligence layer should reduce that work. It should read the combined signals and help the utility move through four practical steps.
- First, it should identify the issue: whether the event points to asset stress, a network fault, a metering problem, a revenue exception or a customer-impacting outage.
- Second, it should explain the context: which feeder, transformer, meters, consumers and events are involved, whether the issue has occurred before, and whether it connects to a wider pattern.
- Third, it should rank the priority: which exceptions need immediate attention and which ones can wait.
- Fourth, it should connect the finding to the next action: a field worklist, inspection route, report, escalation or clear operational answer.
That is the shift from visibility to operational clarity. The converged data is the input. The useful output is a clear call on what is happening, why it matters, how urgent it is and what should happen next.
Also Read: Using AI and AMI Data for Revenue Assurance : Grid
How connected data improves daily DISCOM operations
Connected data earns its keep in the three places a DISCOM spends most of its operational time: restoring supply, protecting revenue and maintaining assets. In each, the decision layer turns the combined signals into a specific call.
- Outage response: A breaker trip on SCADA, last-gasp signals from a cluster of meters, incoming consumer complaints and the GIS network model are four separate feeds. Read together, they resolve to one probable fault section and the consumers behind it. The control room gets the likely fault location, the count of affected consumers, and where the event ranks against everything else open, so the crew is sent first to the outage that restores the most supply.
- Loss and revenue: Meters and billing throw a steady stream of exceptions: abnormal consumption, missing reads, tamper flags, mismatches against the feeder's energy balance. Rather than a long queue to review, the commercial team gets the exceptions that point to real leakage, ranked by likely revenue at stake, with the noise set aside. The output is a short list of sites worth a visit.
- Asset maintenance: Transformer loading, event history, consumption patterns and past failures sit in different systems. Read together, they show which distribution transformers are drifting toward failure, ranked by risk and by the consumers each one serves. Maintenance acts on the unit about to take a locality down before it does, instead of working to a fixed schedule.
In all three cases, the value does not come from seeing more data. It comes from knowing what to do with it. That is when IT/OT convergence starts to matter in day-to-day operations. A connected view stops being another screen in the control room and helps a DISCOM improve the numbers it is measured on.
Where AI fits into IT/OT convergence
AI becomes useful in this layer when it helps utility teams interpret connected data faster.
The goal is not to add another screen to the control room. The goal is to make operational questions easier to ask and answer.
For example, instead of moving across multiple systems, a utility user should be able to ask:
- Which transformers have shown repeated overload events this month?
- Which feeders have the highest number of outage events and consumer complaints?
- Which meters have not returned reads this cycle and are linked to high-value consumers?
This is what natural-language access does. It lets people ask questions in the language of utility operations rather than the language of databases and dashboards.
It also matters what each question runs against. Rather than every query reaching across the utility's whole data estate, it can be scoped to the slice that fits the team: revenue data for a revenue-protection officer, assets and jobs for a field supervisor, live network events for a control-room engineer. Grid AI handles that scoping with one of its features, catalogs, so each team's questions stay grounded in the data that matters to them, and access stays within what their role should see.
Catalogs are just one feature. The real work Grid AI does is the decision layer itself: it reads the connected data, tells the team what is happening and why, and points to the next action.
Also Read: Ask, Build, Watch: How Grid AI Handles Transformer Health : Grid
What utilities should look for beyond data integration?
By the time a DISCOM is comparing platforms, connecting the systems is close to table stakes. Most vendors can show your data on one screen. What separates them is what the platform does with that data afterwards. Five things are worth testing closely.
- It tells you what is happening. A better-looking dashboard is still a dashboard. Ask whether the platform states what is happening in plain terms, or whether it hands your operator a set of charts and leaves the reading to them. The difference shows up on a live shift, not in a demo.
- It prioritises. Visibility without ranking just moves the backlog onto one screen. Look for a platform that orders events by impact and urgency, so a team knows which of tonight's fifty alerts to open first instead of treating them all the same.
- It can explain itself. An answer a control-room engineer cannot check is an answer the team will not trust, and cannot defend to a regulator. The platform should show why it flagged something, traceable back to the feeder, meter or event behind it, rather than a score with no reasoning.
- It connects to action. An insight that ends on a screen still leaves someone to open another system. Ask whether findings flow into the field, billing, outage or reporting workflow the team already runs, so the output is a worklist, an inspection or an exception, and not a note.
- It runs on the systems you already have. A DISCOM has spent years and public funds on SCADA, AMI, the MDM, GIS and billing. The right platform reads across those and adds a layer on top, rather than asking you to replace them. Ask exactly what it needs to connect to, and how long that takes.
Then apply one test to all five: ask the vendor to show them on your own data, not a demo dataset. The integration is easy to show. The decision is the part that earns its keep.
IT/OT convergence is the foundation, not the finish line
Bringing grid, meter, asset, consumer and field data onto common ground is real progress, and every DISCOM should do it. But a connected view is where the work starts to pay off, not where it ends. The measure is not how many systems sit on one screen. It is how quickly the utility turns those signals into the right call on the feeder, the transformer or the exception in front of it.
That call is the half most convergence programmes still leave undone. Closing it is what turns unified data into fewer outages, lower losses and maintenance that lands before failure instead of after.
WorkOnGrid helps DISCOMs build on that layer by making connected utility data easier to query, interpret and turn into operational action. Talk to the WorkOnGrid team about Grid AI.


-compresso.webp)