.jpg)
For utilities, energy monitoring isn’t about tracking a single device or a home circuit. It means gaining operational visibility across metering and operations data, and leveraging that information to drive desired action and governance. This need is becoming more meters being installed.
By late 2023, the installed base of smart meters reached about 76% penetration of the US electricity market. This marks a shift from deployment to extracting operational value from what’s already in the field.
Simultaneously, EPRI (electric power research institute) highlights it is becoming difficult for utilities to translate metering data into operational outcomes. When AMI feeds aren’t fully integrated into distribution and outage-related operations, benefits beyond meter reading seldom show up.
In this detailed guide, we will focus on what utilities must focus on: what KPIs to track, what to monitor first, how a utility-grade monitoring stack works, and to select a system that supports all the above. Before we dive into the details, let’s first begin with what exactly energy monitoring means within the utility context.
What does “energy monitoring” mean in utility operations?
Energy monitoring in AMI refers to the continuous practice of tracking consumption, performance and exceptions throughout the network and operational systems. This framework enables utilities to defect issues early, prioritize them as needed, and resolve them with proof.
Now, this is not just a one-time snapshot or dashboard report. It is a structured procedure that helps understand what is happening across the AMI ecosystem, improving grid reliability, service and revenue protection.
An energy monitoring system is an end-to-end solution framework that supports data ingestion, validation, analytics and workflow enablement. At utility scale, this system becomes important because real-time monitoring will not be useful if teams cannot act on what they see.
The next question to ask is: Why are utility leaders prioritizing energy monitoring in the current era, especially when there is more than enough data in their existing stack?
Why are utilities investing in energy monitoring now?
Today, utilities have access to a vast stream of devices and data, but are not gaining enough operational lift from these data. Leaders are under continuous pressure to show that metering investments translate into tangible outcomes, and not just pile up in the form of higher data volume.
As smart metering programs mature, the conversation moves from the “Did the rollout happen?” to “Is the network performing well, and are exceptions getting closed fast enough to protect revenue?” Looking from an executive lens, there are three outcomes utility leaders should seek to achieve.
CFO outcomes: Revenue protection and lower cost-to-serve
Real-time energy monitoring in AMI networks can help minimize avoidable spend by reducing repeat truck rolls, and lowering billing dispute cycles. With anomalies being detected at earlier stages, utilities can also improve revenue protection. When exceptions are transparent and prioritized as needed, field work becomes a more targeted approach, and operational leakage becomes easier to track and quantify.
CIO outcomes: Security posture, governance, and data integrity
Energy monitoring programs expand the flow of granular metering data across systems, teams, and vendors. Without consistent definitions, audit logs or RBAC (role-based access controls), this sea of AMI data can create risk or confusion instead of improving decisions.
What utilities need here is strong governance and audit trails that help track any changes (who, why and how) and keep reporting defensible.
COO outcomes: Quicker response and operational resilience
Leaders in operations generally prioritize speed and reliability. This means detecting issues faster, reducing exception backlogs and minimizing time-to-triage. Here, the end goal is ensuring a clean shift from visibility to execution with a standardized framework (detect → prioritize → dispatch → verify). In this manner, monitoring becomes a key part of everyday operations, and not just a periodic reporting feature.
The next step for utilities is deciding what to monitor first, so that efforts actually translate to business outcomes.
What key metrics utilities must monitor to get value from energy monitoring?
AMI monitoring creates tangible value the quickest when it begins with the signals that impact billing, integrity, operational workload, and customer trust. For utilities, the goal should be monitoring what drives actions, reduces data noise and improves decision speed.
We have listed below some key monitoring buckets which utilities must prioritize.
Data integrity and availability monitoring
What it is: Utilities should monitor whether AMI and related systems are delivering usable data. Also, the data must be on-time, complete and consistent. This metric is the foundation for every KPI and downstream decision making.
After all, if data quality is unreliable, teams lose valuable time chasing false issues, billing disputes tend to increase and performance reporting becomes hard to defend.
Key signals to monitor:
- Missing reads and late reads by territory, feeder, or segment
- Duplicate reads, retries, and repeated communication gaps
- Exception volume trends (and where exceptions concentrate)
- Endpoint or gateway “silent pockets” that persist over time (this is where energy monitoring IoT and endpoint/device behavior becomes relevant)
Business KPIs to track:
- Read success rate (% on-time, complete reads)
- Exception backlog volume and age
- Time-to-recovery for missing-read pockets
- Repeat offenders (meters/gateways/areas with recurring failures)
Consumption and demand monitoring
What it is: Tracking energy consumption and demand patterns across segments and time windows to get a clearer picture of where consumption shifts, peaks form and anomalies emerge. This data becomes critical in supporting peak planning, measuring program success and helping answer questions like “why did the bill change?” faster.
Key signals to monitor:
- Interval trends by customer segment and location
- Peak periods and unusual ramp rates (sudden climbs/drops)
- Consumption shifts after events (weather, rate changes, program actions)
- Comparisons across similar groups (feeders, substations, customer classes)
Business KPIs to track:
- Peak usage contribution by segment/zone/area
- Forecast error (if forecasting is in scope)
- Baseline accuracy for program measurement
- Anomaly closure time (how quickly abnormal patterns are investigated and resolved)
Leakage or loss investigation signals
What it is: Monitoring patterns that indicate losses or leakage so investigations can start with the highest-probability areas instead of broad guesses. Tracking such signals also help AMI planners improve field productivity and measure recovery rates better, instead of spreading their crews thin. The same also applies strongly to water utility networks to prevent issues like leakage, backflow, reverse flow, etc.
Key signals to monitor:
- Repeat anomaly clusters by zone/feeder/segment
- Sudden consumption drops/spikes across groups that should behave similarly
- Meters or areas showing persistent irregular patterns over time
- Investigation outcomes that repeatedly point to the same root causes
Business KPIs to track:
- Investigation cycle time (detect → resolve)
- Recovered billed consumption (where applicable)
- Repeat anomaly rate after fixes
Customer impact monitoring
What it is: Keeping track of signals that often turn into customer complaints and service friction. This can help detect issues before they escalate into disputes, repeat calls, or even reputational risk. The monitoring approach minimizes cost-to-service and improves defensibility when claims are reviewed.
Key signals to monitor:
- High-bill triggers and sudden usage deviations
- Dispute drivers tied to missing reads or estimate-to-actual transitions
- Service continuity signals that correlate with complaints
- Patterns by geography or segment that indicate a common driver
Business KPIs to track:
- Complaint volume trend (by region/segment)
- First-contact resolution rate
- Time-to-triage for disputes
- Repeat call rate for the same issue type
As we saw in above, knowing what to monitor is critical for any utility to fully utilize AMI data. The next step here is ensuring monitoring becomes reliable at scale, through architecture and integration.
What does a utility-grade monitoring architecture look like?
And energy monitoring architecture for AMI networks is generally built with one key goal in mind: turning high-volume metering and operations data into insights for informed decision making. It is also important to build a data management layer that ensures the data remains consistent, updated to near real-time and stored in structured stacks, so that it adds the right value based on varying operational contexts.
Platforms or solutions that are integrated to support such architecture should also facilitate auto-routing of issues to the right stakeholders, so that monitoring leads to outcomes. Let’s explore the key layers in a utility energy monitoring framework.
Data sources: What the monitoring systems should see
In utility metering projects, smart meters first transmit data, which is first sent to HES (head-end systems) and then MDMS (meter data management systems) for VEE and analysis. This is where consumption trends and event signals enter the AMI stack, get validated and sent downstream for defensible reporting.
For comprehensive energy monitoring, utilities also need context to the data stored across operational systems.
- OMS (outage and restoration activity) to understand service interruptions and field events
- CIS (customer history) to support high-bill disputes and complaint triage
- GIS (network topology) to tie issues to feeders/zones/assets instead of isolated meter IDs
- SCADA/ADMS signals only where needed, as additional context for grid conditions, and not as a replacement for AMI monitoring systems
Data pipeline: How raw signals become usable at scale
A reliable data pipeline in a utility network should enable: data ingestion → normalization → time-series storage → insights & analytics → workflows. It goes beyond having just “ice-to-have” dashboards and reports. True operational intelligence is attained when the data pipeline is consistent enough to support repeatable and reliable decisions.
In this stage, data mapping also becomes critical. This means creating a structured (often visual) connection between data fields stored across scattered utility systems. For example, AMI meter data is linked with customer billing information to ensure that usage data is correctly mapped to the right account for accurate billing and outage detection.
If meter → premise → feeder relationships are outdated or incomplete, even reliable analytics might not get routed to the right team or personnel. The result? Alerts get sent to the wrong stakeholders, investigation queues become longer and the trust in data drops.
Action layer: Where outcomes are created
Utility monitoring only creates real value when it drives action. A utility-grade monitoring stack should follow a clear trail: Alerts → routing → ownership → dispatch → verification. With this framework, utilities can make the shift from visibility to execution.
This is also the phase where data governance becomes non-negotiable. Executives need confidence that the numbers are defensible; through clear ownership, end-to-end data lineage, and measurement practices that prove “what changed and why.”
Here, two practical signals matter at the leadership level.
- Is the organization reducing operational noise over time? AMI monitoring programs mature when the backlog of recurring exceptions shrinks, repeat offenders are addressed systematically, and field work becomes more targeted, not just more active.
- Are outcomes being verified and communicated consistently? When stakeholders ask why a KPI moved, the answer should be traceable to evidence (data + actions taken), not assumptions or spreadsheet reconciliation.
Note: A useful way to frame this for governance teams is investing in energy management systems that support audit-ready monitoring routine by combining workflow ownership with measurement and verification discipline.
Once leaders have a clear understanding of what an energy monitoring system’s architecture looks like, the next focus should be asking what the dashboards will look like, and which KPIs actually matter?
What type of dashboards do utility leaders use for energy monitoring?
Dashboards matter because they shape decisions. But different teams need different insights and views. A CFO doesn’t need to see every missing read. An operations lead doesn’t need a high-level KPI that hides where the work is piling up. The best energy monitoring programs use three dashboard layers; each tied to clear outcomes and ownership.
Executive dashboard: Cost, reliability and defensibility
What it is: A set of metrics that highlight whether monitoring is improving enterprise outcomes, and not adding to noise.
Why it matters: Executives should be able to view whether the program is minimizing operational costs, protecting revenue, and producing evidence that hold up during reviews.
Key metrics to track here-
- Cost-to-serve signals: Truck rolls avoided, repeat field visits reduced, cost per resolved exception
- Billing integrity signals: Billing dispute volume trend, estimated-to-actual bill transition issues, exception backlog impacting billing
- Reliability signals: Time-to-triage for outage-suspected clusters, restoration verification time (where applicable)
- Auditability signals: % of KPIs with traceable source data, % of changes with “who/what/when/why” logs
Operations dashboard: Exceptions, queues, and closure speed
What it is: The360-degree view for everyday management; what needs attention today and who owns it.
Why it matters: Most programs lose ROI when exceptions accumulate faster than they close.
Key metrics to track here-
- Exception volume and aging: missing/late read counts, duplicates, top recurring exception types
- Triage readiness: queue by feeder/zone/contractor, priority by impact (revenue, safety, repeat frequency)
- Closure discipline: SLA compliance, time-to-close by exception type, repeat offender rate after fixes
- Field effectiveness: first-time fix rate (where tracked), “false alarm” rate that drives avoidable dispatch
Customer dashboard: Transparency and reduced disputes
What it is: A customer-facing dashboard that helps explain energy consumption and reduces confusion, without exposing raw complexity.
Why it matters: Many complaints come from “I don’t understand this bill,” and not from the meter itself.
What a standard customer dashboard looks like-
- Simple usage trends and comparisons
- Clear explanations during estimate-to-actual transitions
- Fast paths for dispute resolution and support requests
In our next section, we will explore key criteria to keep in mind when investing in energy monitoring systems. The selection framework should focus on solutions that can support dashboards with reliable data, consistent definitions, and closure workflows. This is what truly separates "monitoring" from reporting.
How to choose the best energy monitoring system for utilities?
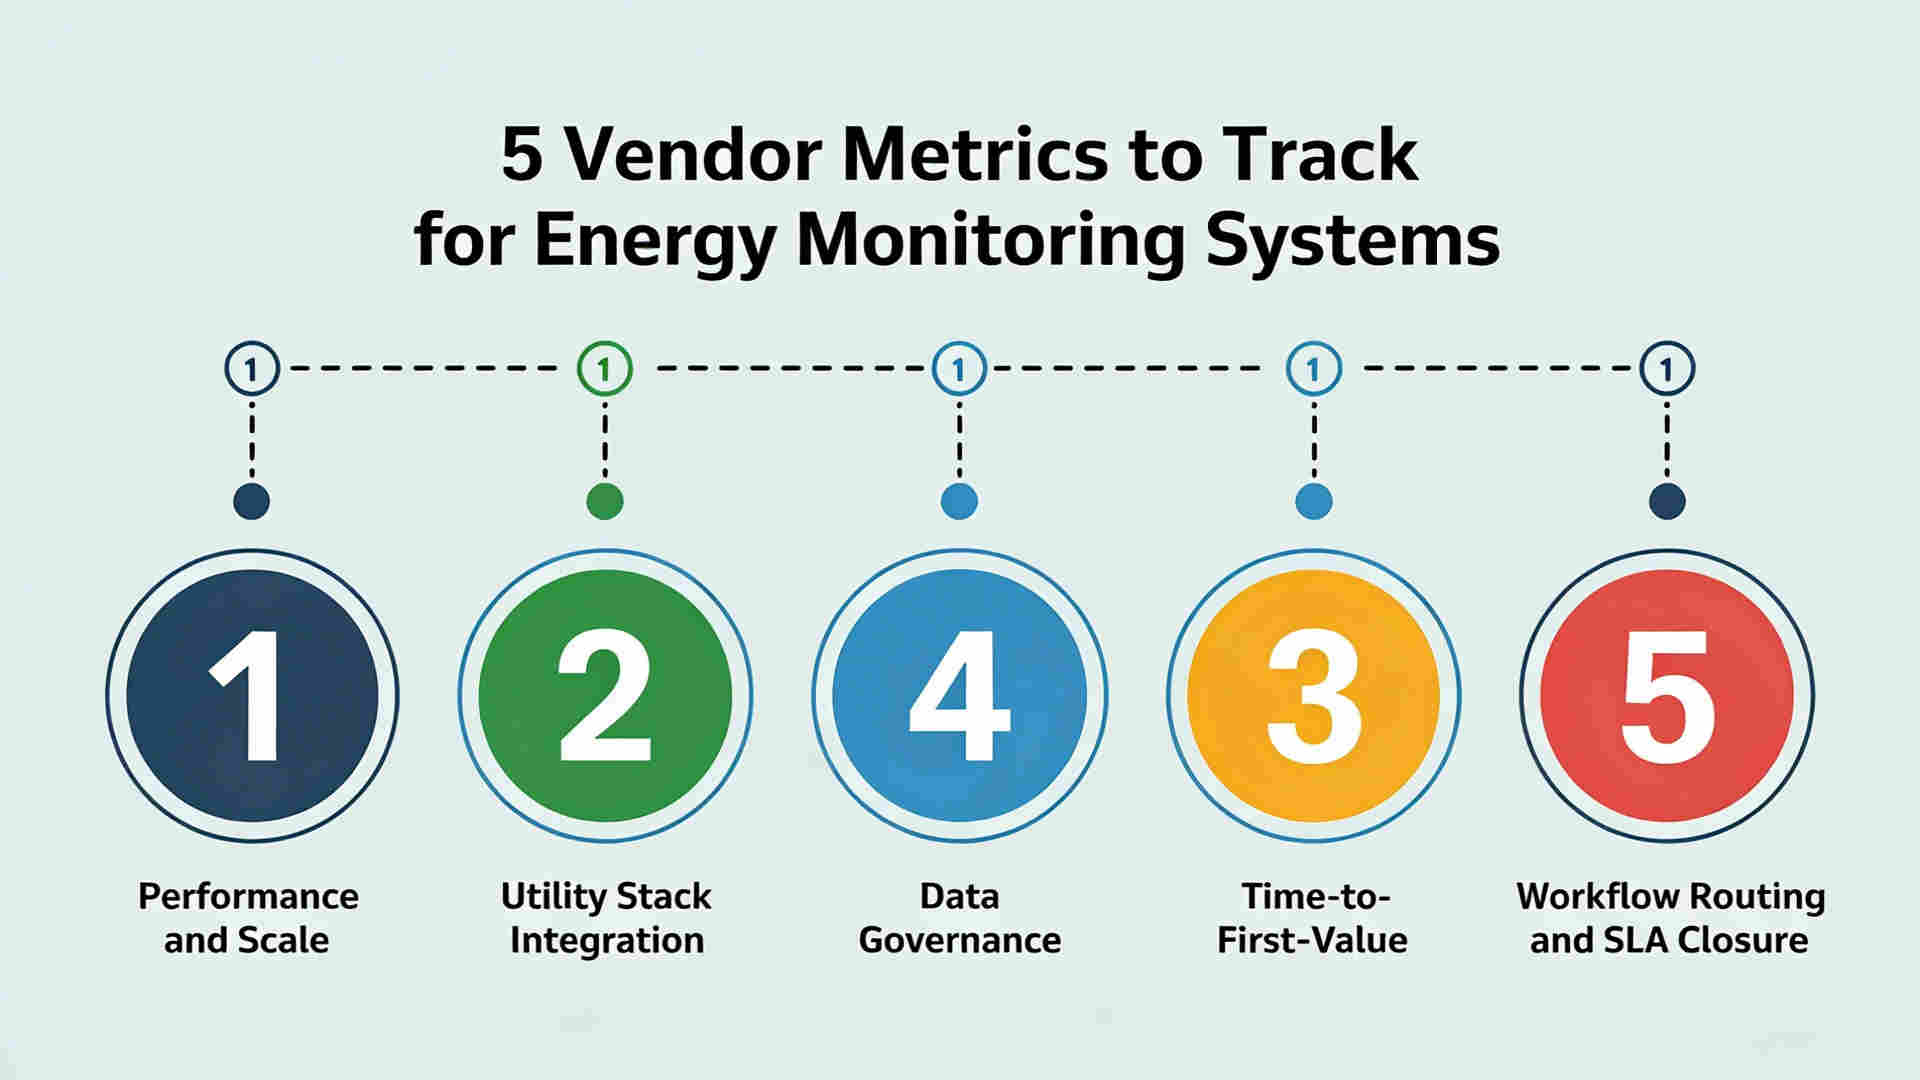
A practical framework to evaluate the right solution here is testing whether it can support three broad utility goals: high-volume data management, streamlined cross-team handoffs, and audit-ready reporting. Below is a utility-grade energy monitoring system buyer checklist, one that facilitates executive decision making.
Scale and performance (interval volume + reliability)
A platform may look perfect in demos and still fall short in real-life implementation if it is not designed to handle high internal data volume and exception spikes. Some necessary capabilities of AMI energy system include:
- Ingesting and processing high-frequency reads without backlog during peak windows
- Supporting mixed data granularities (15/30/60 minutes) without experiencing performance drop-offs
- Analyzing how the platform handles late, missing, or duplicate reads, and whether exceptions remain visible based on task ownership and severity
- Asking what “normal operating load” looks like and how performance is monitored over time
Integration with utility stack (monitoring that understands context)
Utility monitoring loses value when insights can’t be tied to the right operational context. The ideal energy platform should be able to:
- Incorporate OMS, CIS, and GIS context so that alerts are routed by feeder/zone/site, and not only by meter ID
- Use SCADA/ADMS signals only where needed, as additional context, and not treat them as a replacement for AMI monitoring
- Handle topology and meter/asset relocation without breaking historical comparisons
Governance (RBAC, audit logs, change history, consistent KPI definitions)
Governance is what prevents “two versions of truth” and keeps reporting defensible. Utilities should check whether the system enables:”
- Role-based access by utility function (so only the right teams can change rules, thresholds, and reports)
- Audit logs for critical actions (rule edits, overrides, acknowledgements, closures, and approvals)
- Change history with clear rationale (who changed what, when it changed, and why it changed)
- Consistent KPI definitions across views (so dashboards, exports, and reports reflect the same logic)
- Controlled reporting and template governance (standard report packs, version control, and approval flows)
Actionability (workflow routing, SLAs, closure verification)
Actionability is what separates monitoring from reporting. Utilities should check whether the system enables:
- Workflow routing with clear ownership (so every exception lands with the right team, not in a shared queue)
- SLA-based execution and escalation (so high-impact issues don’t sit unresolved)
- Context-rich alerts (trend, recent history, location/topology context, and what changed recently)
- Verified closure, not just acknowledgement (so “resolved” means the underlying issue is fixed and confirmed)
Time-to-first-value (pilot, rollout plan, operating cadence)
A strong platform is one that produces measurable value quickly and scales without rework.
- Ask what will be delivered in the first 4–8 weeks that teams will actually use
- Confirm phased rollout by region or program type is supported without redesign
- Validate the operating cadence required to keep exceptions under control
- Ensure ownership is defined for thresholds, escalation paths, and ongoing tuning (who manages thresholds, escalation paths and rule updates)
Once the evaluation criteria is clear, the next step for utilities is applying them within their own operational context. This is how energy monitoring truly becomes a program that delivers measurable ROI and not an added reporting layer.
Conclusion
Utility leaders witness the highest returns when the monitoring framework is supported by reliable mapping, exception handling and defined with clear ownership across teams. First, organizations must benchmark their current readiness across three areas: data foundation (meter-to-premise-to-feeder mapping), exception data load handling (volume, aging, repeat violators), and workflow execution (SLAs, escalation routes, closure loops).
Schedule a quick demo with Grid can help benchmark where things stand today. A short conversation with our team can also highlight the fastest paths to ROI: fewer repeat exceptions, more targeted field work, stronger billing integrity, etc.

.jpg)
.jpg)
.jpg)


