
It’s the dawn of a new month. We are happy to be back, bringing you some exciting new features.
We always look forward to understanding your needs and bringing innovation that helps your business grow. That said, here are our two new features: Conditional Formatting Of Table Widgets & Visibility For Columns.
Conditional Formatting Of Table Widgets

Conditional formatting is a feature that lets you apply specific formatting to cells on meeting certain criteria. We often use this feature as color-based formatting to highlight, emphasize, or differentiate the information stored. Conditional formatting calls attention to important data points such as deadlines or budget items.
Large data sets become more digestible with a visual organizational component. Table widgets are getting smarter with conditional formatting. You can set rules for the data. If the conditions are satisfied, you can highlight the data with text and background colors of your choice.
SparkLines For Columns
First things first, let’s have a look at what sparklines are and why we need them.
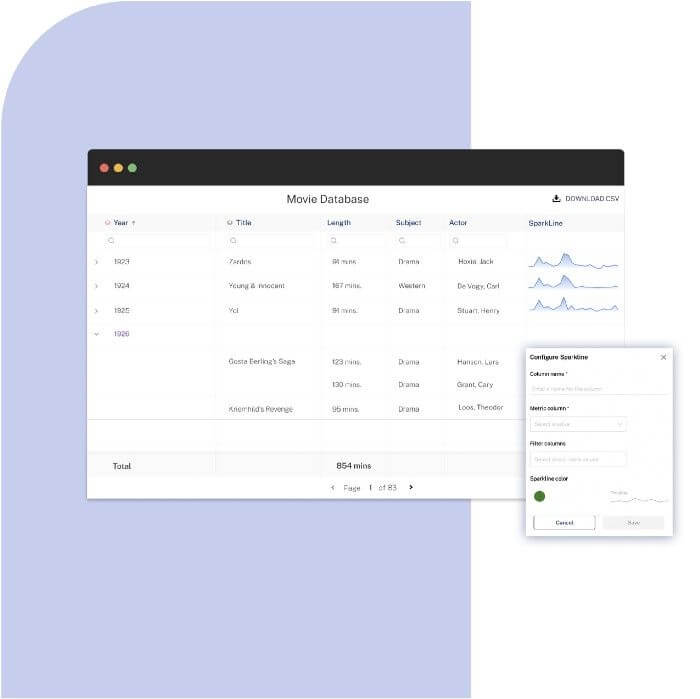
SparkLines are small embedded line graphs to illustrate trends in a series of values, such as seasonal increases or decreases, stock prices, etc. We often use these graphs in reports, presentations, dashboards and scoreboards. The best example of sparklines is the way how stock prices are represented.
You can now add sparklines to your table widgets. Representing your data trends just became better.
Set Visibility For Columns
What if I want to see just a few entries that satisfy the particular criteria I set?

You can now add visibility to columns. First, you can set rules for columns. Only the entries that satisfy these particular columns will be visible on the mobile devices.
But where does this feature come in handy? By adding the visibility of your columns, analyzing the result of surveys and conducting impact assessments become easier. Let’s consider the following scenario. You are surveying to collect information from students who belong to various streams. You will have a list of questions that belongs uniquely to each stream.
Now, with this option, you can create visibility of columns when the student enters their stream. If a student belongs to stream A, the column XYZ is visible. If they choose stream B, the column LMN becomes visible. If steam C, RST is visible, and so on. Please note that you can set up this feature on the web, but can be viewed only on mobile devices. We expect these features to help you and your team in exploring Grid and boosting your operations. As always, please feel free to drop us a line with any feedback. We will be back with more exciting updates next month.
.png)

.jpeg)


