
Dashboards are visually appealing to look at and when configured properly can be incredible productivity boosters. But businesses need much more than pretty graphs. The utility business is no different. Energy grids in particular are becoming smarter, more interconnected and, as a result, an unlimited barrage of data is being transmitted almost every hour to systems that struggle with advanced analytics on the basis of that data. In fact, some smart meters can share data at intervals of 15 minutes or even less. Amidst such developments, legacy infrastructure can pose a big challenge as they might not fit or align with emerging requirements.
The core challenge here is not just limited to data volume. Organizations must figure out what is the next line of action with that data. How would they act upon it, interpret it, use it to improve business processes, etc. The main goal is to figure out how to turn data into meaningful attributes in operational contexts.
The central drawback remains, dashboards by themselves are not outcome driven. They provide the numbers, in a manner that would be easy for you to interpret. But, making sense of those data points and taking action still depends completely on you.
The majority of utilities even today use standalone BI tools and dashboards to monitor the data coming from smart meters and stored in various devices within the infrastructure. This in itself, can turn problematic because:
- BI tools are built for visualization, and not sophisticated analysis. At the end of the day, utilities end up paying an extra amount of money for a separate platform to conduct data analysis.
- Tools like PowerBI and Tableau in fact support data storage, but they come with certain limitations. The data is stored as a snapshot and does not get updated in real-time. Most BI tools support data storage only temporarily, with no support for data traceability, lineage, or historical tracking.
- Once a dashboard presents visualization of a result, that is where their role ends. Their central role is to display data, not acting upon it. They cannot automatically send an alert, trigger a workflow or push out APIs/automated actions in case of SLA breaches.
Business Intelligence (BI) tools lack the necessary architecture to support the entire data pipelining process. And this is where Grid outperforms BI tools. Be it data capture, storage, processing the information, sharing it for reporting or even cross-system export, everything is taken care of. Grid is not just visually appealing, it is an end-to-end operational intelligence platform, automating and streamlining the entire data lifecycle process.
The Challenge with BI Tools in Managing Data Pipelines
Business Intelligence solutions, however modern they may be, will always remain a piece of the puzzle. They are almost a near-perfect solution for static observation from time to time. But they are definitely not a good option for active monitoring. When businesses use a BI tool, let’s say Power BI or Sisense, this is how their architecture generally looks like.
BI architecture overview
Data storage: Not handled by BI tools. Organizations end up adopting third party tools like Snowflake, BigQuery or Databricks.
Integration layer: Businesses end up building a custom layer or add them via third-party connectors.
Reporting engine: BI tools do not support document level integration or compliance grade reporting.
Visualization: Tools like PowerBI, Sisense, Tableau, etc, handle this process.
Outbound API: Not supported by BI tools. Businesses require custom scripts.
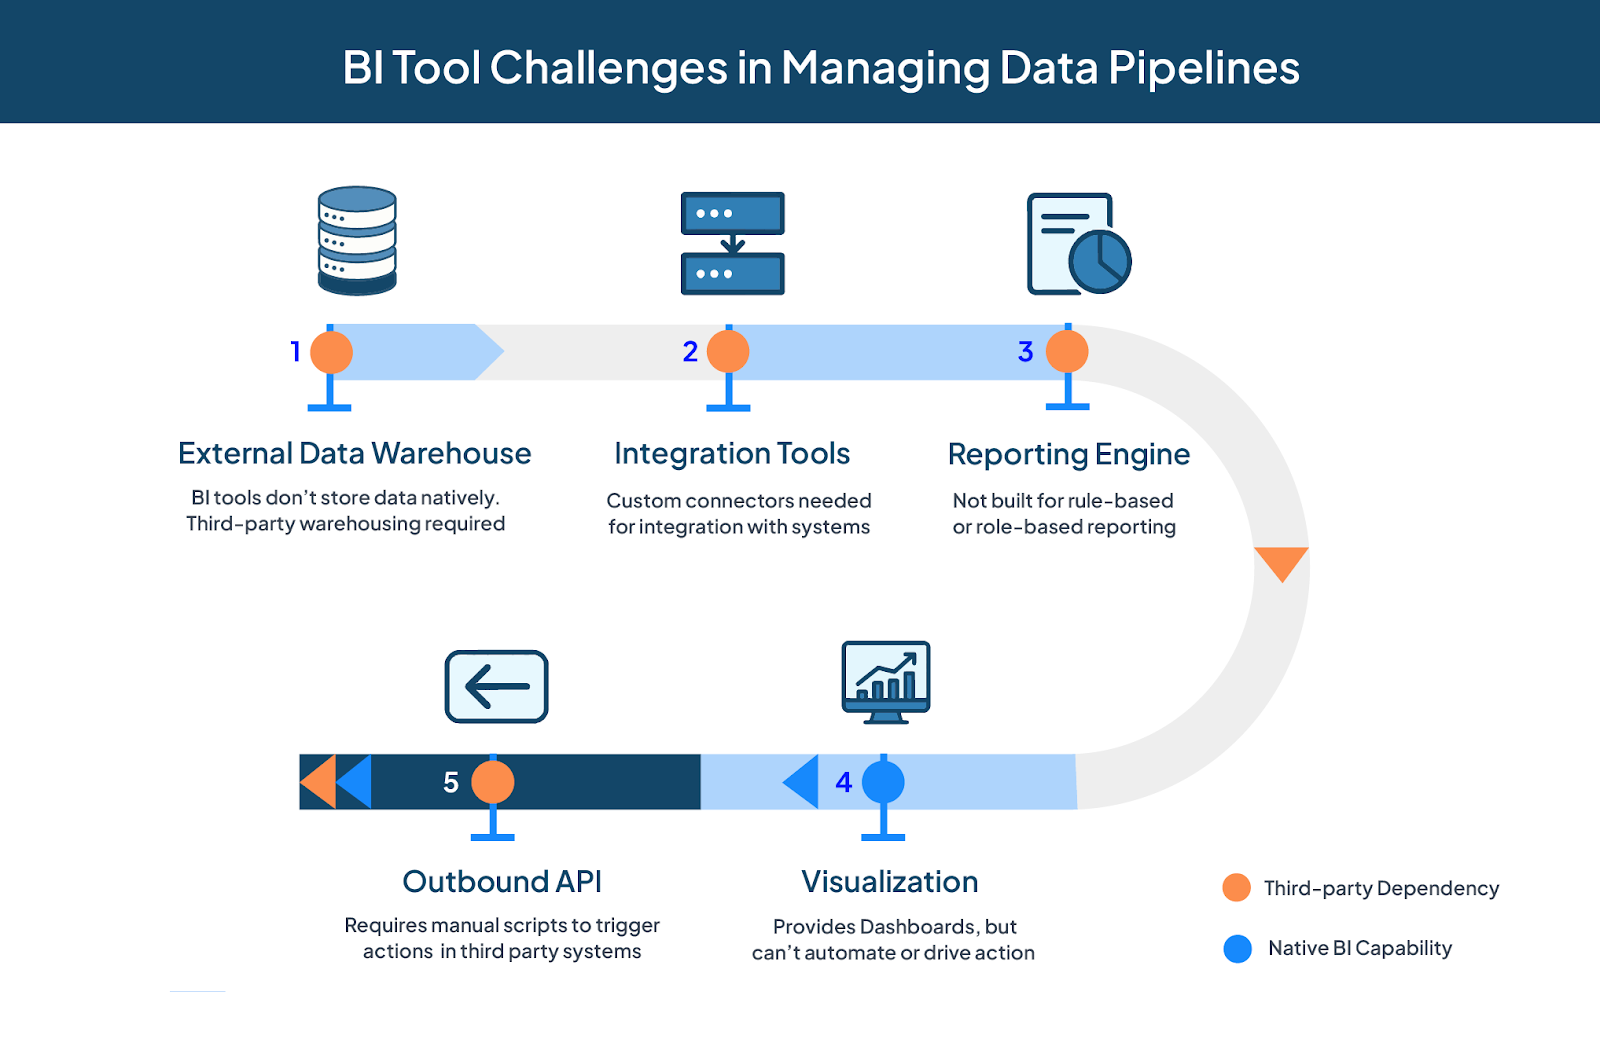
As we see it above, there are multiple components in a data pipeline. With a BI tool, businesses have to stitch them together. More often than not, this is achieved with a third-part help.
The result? More complex processes, more costs, and more maintenance overhead.
Grid: The End-to-End Data Operations and Management Platform
With Grid, organizations no longer have different solutions for different purposes within the data pipeline. It is a one comprehensive solution that overcomes the need for a fragmented infrastructure. An added layer that not just consumes data in near real-time, but makes sense of it, interprets it and processes it. A real-time intelligence layer that eliminates the need for human intervention.
Let’s explore how Grid’s data stack can be used in managing the data pipeline across different touchpoints.
Data storage
Grid has a dual-architecture database system. It leverages OLTP (MySQL) for real-time transactions and OLAP (Clickhouse) for analytics at scale.
MYSQL for Real-Time Transactions
For OLTP, MySQL helps handle high-velocity, everyday transactions:
- Field updates
- Asset tracking
- Meter installation and configuration
- Inventory and material management
Who uses it: field supervisors, contractors, engineers, etc.
What are the systems involved: Browser-based dashboards, Grid’s frontline app, mobile applications, third-party AMI systems, etc.
ClickHouse for Scalable Analytics and Reporting
For OLAP, ClickHouse acts as a long term analytics and reporting engine. Data is stored in a columnar format, allowing:
- Quick aggregation across millions of records
- Complex queries over years of operational data
- Custom metrics and KPIs
Who uses it: CXOs, operations managers, analysts
What are the systems involved: KPI charts, performance summaries, and dashboards
Integration layer
Grid has a native integration layer that connects with field apps, SCADA, DERMS, AMI devices, CRMs, IoT devices, and much more. It has been built with the understanding that utility data doesn’t come from a single source or touchpoint.
The comprehensive data management platform facilitates interoperability across networks by facilitating integrations across levels.
Device level integrations
Grid can natively connect with:
- Smart meters
- SCADA and AMI devices
- IoT devices
- GPS and Geofencing solutions
Enterprise level integrations
Grid comes with API and connectors for:
- CRMs, such as Salesforce
- ERPs, such as Oracle or SAP
- Workforce Management Solutions, like Jira or Zoho
- GIS tools, enabling location-based tagging
- Billing platforms, like Oracle CC&B
The result? Grid removes the need for a custom middleware or costly system integrators, with the system ingesting and contextualizing data across the operational stack.
Reporting layer for every stakeholder
Grid comes with a configurable reporting engine in-built within the framework, supporting role-based access. This means that every personnel has access to information they require, and that too in a structured, auditable format.
Highly configurable
Now, reports can be tailored based on:
- Role: Executives, project managers, supervisors, engineers, etc.
- Geography: Utility region, district, site of the project, etc.
- Functional requirement: SLA monitoring, billing, milestone management, asset use tracking, etc.
Rule-based schedule and delivery
Teams can now define rules and triggers, with commands such as:
- If any activity, let’s say ‘ACT’ is delayed by 24 hours, notify the zone supervisor.
- Every friday, share reports of asset and material utilization to the central warehouse
In Grid, reports can be exported in CSV or PDF format, delivered via email, or shared via webhooks/APIs to other systems. Organizations can eliminate the need for manual scripting and Excel compilation, or dependency on third-party report builders.
Built-in visualization interface
Grid’s operational stack includes native charts, graphs and dashboards with options for filter, drill down and export options(CSV, PDF).
Dashboards for utility workflows
- Users can visualize datapoints for streamlined tracking, planning and business execution. Some of them include trends such as work order status (by location), set up hindrance trackers that cause delays, vendor wise performance, and SLA adherence metrics.
- Stakeholders can also drill down or use filters to view information based on time periods, type of asset, operational hindrance, or contractors/vendors.
RBAC (Role-based access control)
Users can set up dashboards to ensure they view only what’s relevant to them, such as:
- Zone managers setting up filters for region summaries
- Engineers viewing task level data
- Executives or middle management able to see macro KPIs
Teams are able to interact with their data natively, without spending a single penny on a separate BI license or facing the challenge of fragile dashboard layers.
Outbound APIs
Perhaps, the most distinctive feature that separates Grid from BI tools. Our solution doesn’t just highlight data, but acts on them and drives workflows automatically.
Real-time interactions between systems
Outbound actions can be automated, or triggered based on analytics, such as:
- If a particular rule, say rule ‘Y’ is breached, a ticket in Jira will be auto-created and sent to the concerned personnel
- If a work order ‘X’ is delayed, the WFM solution is alerted, along with updating Oracle CCMD
- In case of a field escalation, alerts are automatically sent to the field team mobile app, facilitating quick action.
How integrations with various systems work:
- Jira: Tasks are automatically created for engineering issues
- Oracle CCMD& CC&B: Consumer facing data like service delays or outages are synchronized with other systems
- SMS/Push notifications/Email: In case of breaches, teams are instantly notified
With Grid, the loop on data isn’t just closed. Utilities are able to facilitate automated actions that are timely and relevant to the issue.
Final Thought: Why Grid OutPerforms BI Tools in Managing Data Pipelines
Unlike BI tools, Grid is not built for passive or static reporting, but to facilitate real-time action. Actions that enable utilities to operate in a smarter, transparent and faster manner.
Summarizing our notes and findings below:
Traditional BI tools were built for retrospective visibility, not for real-time operational agility. Yes, they serve their purpose. But it just isn’t enough for forward-looking organizations. With Grid, it becomes easier to streamline the data pipeline journey.
Why? The system not only shows what’s happening, it triggers actions based on requirements. Think of it as a business outcomes platform, allowing utilities to translate raw data into relevant actions across the grid infrastructure.
Teams, it may be time to rethink what your data platform is actually supposed to do. Turn your data into operational outcomes and drive real-time automated decision making at scale. Connect with one of your experts today, and find out how.

.jpg)
.jpg)
.jpg)


